.webp)
SUMMARY
SAF Neat HEFA NWE FOB Barges eased 2.1% MoM in August to average $2,699.93/MT, even as the market remains up 14.2% YoY. The month's clearest signal was the green premium (SAF vs Jet FOB), which compressed 9.8% to $1,423.74/MT as conventional Jet FOB rallied 8.3% MoM on continued Middle East/Hormuz-linked strength while SAF's mandate-driven pricing held closer to flat. Within the HEFA complex, SAF and HVO diverged sharply: the SAF-vs-HVO allocation spread flipped from a $23.62/MT SAF premium in July to a $166.84/MT HVO premium in August. Feedstock costs held broadly flat while SAF's own price fell, compressing the UCO-to-SAF production margin by roughly $50/MT on average and $107/MT close-to-close. The order book also flipped from bid-heavy in July to offer-oriented in August, consistent with the softer pricing. The forward curve stayed backwardated but flattened, with M1-M12 narrowing 13.4% to $280.00/MT as the back end rallied harder than the front. The forward watch is whether Hormuz-linked jet strength persists, pressuring the green premium further, and whether the SAF-HVO spread inversion proves durable or reverts as producers rebalance HEFA output.
MARKET ACTIVITY
- The order book shifted from a clear bid-heavy skew in July to an offer-dominated one in August, a reversal in the balance of buying versus selling interest rather than a shift in trade counts alone
- No SAF trades printed as completed in August, a step down from July's light but confirmed trade activity; order-book activity continued but nothing crossed, consistent with SAF's typically thin spot liquidity
- Intermediary positioning: integrated majors and trading houses drove the offer-side buildup, while pulling back materially from the bid side versus July's more buy-side-active stance
- Producer buying, unusual: a HEFA/SAF producer appeared on the bid side in both months; a producer buying rather than selling its own product signals either disrupted upstream supply or working-interest exposure in downstream margin
- The buy side thinned and broadened out in August versus a more concentrated July bid stack, consistent with the offer-heavy skew and softer close-to-close SAF pricing
PRICE ACTION
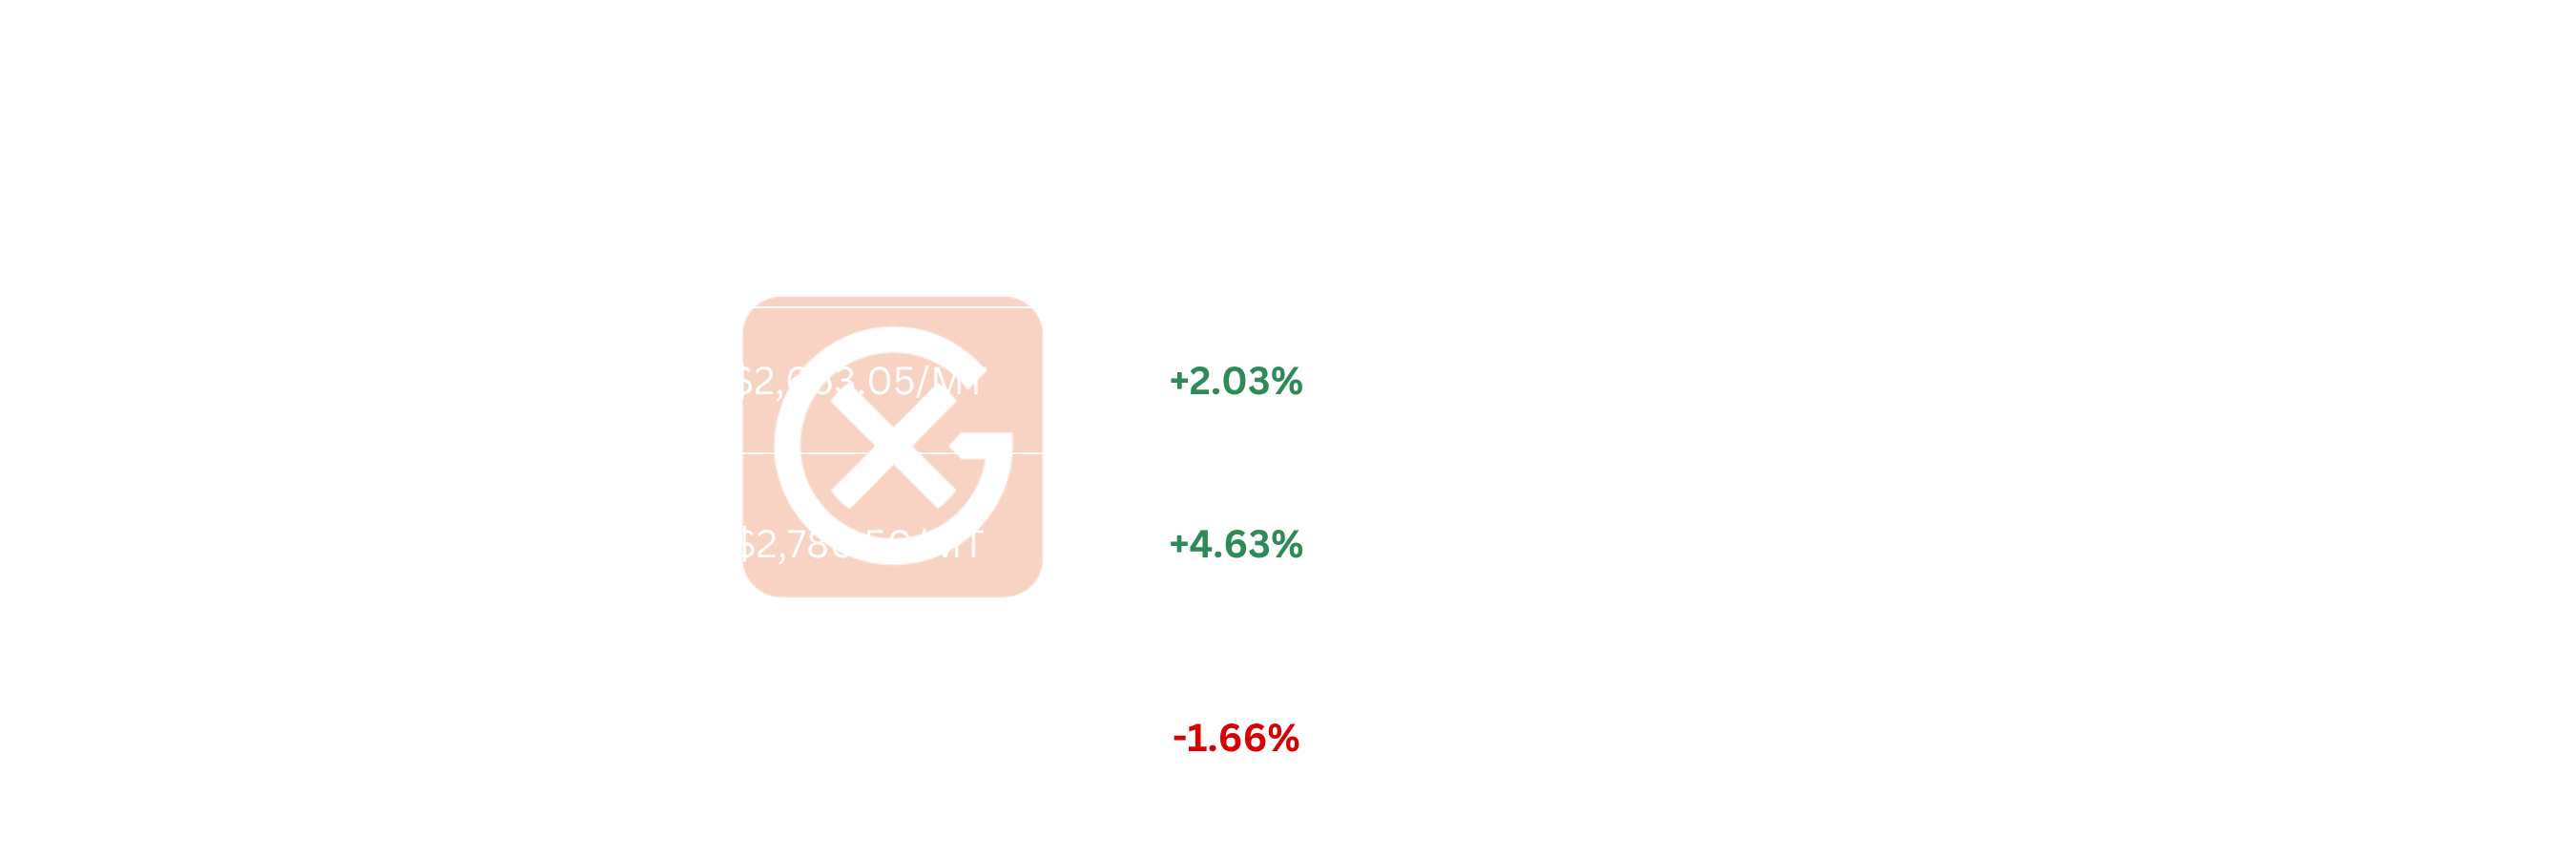
- Opened $2,738.25/MT (3-Aug), closed $2,759.25/MT (28-Aug), averaging $2,699.93/MT vs July's $2,756.47/MT (-2.05% MoM); up 14.2% YoY vs August 2025's $2,364.38/MT
- Monthly high $2,819.50/MT (21-Aug); monthly low $2,538.50/MT (4-Aug); intra-month range of $281.00/MT, narrower than July's $363.00/MT
- Largest single-day move: -$120.00/MT (-4.38%) on 4-Aug, the sharpest sell-off of the month
CROSS-MARKET DYNAMICS
- Jet Fuel NWE FOB Barges averaged $1,276.19/MT in August, up from $1,178.59/MT in July (+8.3% MoM), a materially sharper move than SAF's -2.05% MoM decline
- SAF FOB vs Jet FOB (the green premium) averaged $1,423.74/MT in August vs $1,577.88/MT in July (-9.8% MoM); widest at $1,491.25/MT on 3-Aug, narrowest at $1,362.75/MT on 17-Aug
- Mechanism: continued Middle East/Hormuz-linked conflict kept conventional jet prices elevated through August, while SAF's mandate- and production-cost-driven pricing showed comparatively muted response, mechanically narrowing the premium
- SAF FOB vs RED HVO Class II FOB Barges, the key HEFA allocation spread, swung from a +$23.62/MT SAF premium in July to a -$166.84/MT HVO premium in August, a full sign reversal, deepening to -$233.75/MT on 14-Aug before a partial recovery to -$161.25/MT at month-end
- It sits against a backdrop of chronic HEFA capacity underutilization reported for a major European producer (renewable production at 75% utilization in Q2 2026, down from 81% a year earlier)
- UCO NWE FOB averaged $1,335.60/MT in August vs $1,342.07/MT in July (-0.48% MoM), a far smaller move than SAF's price decline; UCO closed the month at $1,365.00/MT (28-Aug), up 1.87% from July's close
- Feedstock cost held its ground into the close while SAF's finished price retreated: a margin squeeze for HEFA producers rather than a feedstock-driven cost story
CURVE STRUCTURE
- The curve rallied across every tenor (M1 +$154.75/MT, M12 +$198.25/MT), with the back gaining more than the front in absolute terms; M1-M12 narrowed to $280.00/MT, below the module's typical $400-500/MT range
- Liquidity thins materially past M6 in this market; the M12 move should be read with that caveat rather than as a firm structural repricing signal
PRICE VOLATILITY
- SAF's August CV of 3.05% sits within its six-month range (1.44% to 9.70%); the -2.05% MoM average decline occurred without an accompanying volatility blowout
SOMETHING TO WATCH
- Green premium level as the compliance-value canary:
- Observation: green premium narrowed to $1,423.74/MT average in August, touching $1,362.75/MT intraday on 17-Aug
- Why it matters: continued compression toward the low end of the module's normal $1,000-1,500/MT range would signal conventional jet strength outrunning SAF production economics rather than a durable narrowing of the mandate-value gap
- What to monitor: daily SAF FOB vs Jet FOB green premium; Strait of Hormuz transit and ceasefire headlines
- SAF-vs-HVO allocation spread as the capacity-allocation canary:
- Observation: spread flipped from +$23.62/MT (SAF premium, Jul avg) to -$166.84/MT (HVO premium, Aug avg), deepening to -$233.75/MT on 14-Aug
- Why it matters: a sustained HVO premium could pull HEFA capacity toward HVO output over SAF, tightening SAF supply into compliance-heavy months
- What to monitor: daily SAF-vs-HVO spread; producer capacity-allocation disclosures
- Feedstock-to-SAF margin as the production-economics canary:
- Observation: UCO-to-SAF margin narrowed from roughly $1,414/MT (Jul avg) to roughly $1,364/MT (Aug avg), with sharper compression close-to-close
- Why it matters: continued margin compression could further reduce producer incentive to run HEFA output toward SAF rather than HVO
- What to monitor: weekly UCO NWE FOB vs SAF FOB print
Note: All figures, prices and market activity referenced in this report are based on the period covered by this monthly update.
.webp)

.webp)