.webp)
Jet CIF NWE averaged $1,190.60/mt in July, up 15.30% MoM and 60.32% YoY, rising from $975.00/mt (open) to $1,350.50/mt (close) after the collapse of the three-week US-Iran ceasefire on 7-8 July re-priced Gulf transit risk and produced the month's largest session at +$121.00/mt. Houthi attacks on two Saudi tankers in the Red Sea on 22-23 July opened a second chokepoint alongside Hormuz and drove the monthly high of $1,400.25/mt (23-Jul). The mechanism was product-specific rather than crude-led: June refinery runs held 6 mb/d below year-ago with Middle East export refineries still down (IEA), and the crack versus Dated Brent expanded $21.99/bbl to $67.48/bbl, closing at its monthly high. The jet-ULSD regrade fell to -$6.01/bbl as Russia's diesel export ban through 31 July cut loadings to 234,000 b/d over the first ten days against a 2025 average near 817,000 b/d (Kpler). NWE absorbed the escalation first on its structural dependence on Gulf jet imports, with the East-West discount more than doubling to -$94.38/mt. The curve bull steepened, M1-M12 widening $240.50/mt, but the move sat in M6 to M12 and prompt spreads peaked nine days before flat price. The month's real signal sits at the end: strikes paused 24 July and resumed from 28 July. The physical jet market responded to higher LSGO Futures by weakening the cash diff from -$1.47/mt (24-Jul) to -$53.71/mt (30-Jul).
MARKET ACTIVITY
- Physical: 51 bids vs 52 offers (0.98) against June's 30 vs 49 (0.61). Bids rose 70%, offers 6%. Buyers arrived
- Derivatives: 172 bids vs 144 offers (1.19) against June's 198 vs 310 (0.64). Offers fell by more than half, bids 13%. Sellers withdrew, and the ratio flipped without a single new bid
- The two physical books diverged: cargoes stayed offer-heavy at 29 vs 40 (0.73 from 0.44), barges went bid-dominated at 22 vs 12 (1.83 from 0.94) on a 29% drop in barge offers
- Executions rose 85% to 135, but the jump was paper-led at 109 of 135: derivatives 54 to 109 (+102%) against physical 19 to 26 (+37%). Cargoes cleared 8 trades at 27kt, 216,000 mt vs 81,000 mt in June
- Concentration ran on both sides but in different books: intermediary BP Oil International bought 7 of 8 cargoes and 54% of all physical trades; intermediary TOTSA sold 17 of 18 barges and 65% of the physical sell-side, with no cargo participation
- Gunvor sold 64 and bought 23 in paper, BP bought 57 and sold 21: intermediary positioning, not flow. Gunvor was outside June's top five in either role; Unipec fell from top seller at 31 to 13
PRICE ACTION
- Open $975.00/mt (1-Jul), close $1,350.50/mt (31-Jul), avg $1,190.60/mt vs June $1,032.60/mt (+15.30% MoM; +60.32% YoY vs $742.64/mt), 23 assessment days
- High $1,400.25/mt (23-Jul), low $961.25/mt (2-Jul); intra-month range $439.00/mt. The low printed one session after the open and was never revisited, so the month was a one-directional climb that stalled only in the final week
- Three largest sessions all upward: +$121.00/mt (8-Jul), +$96.50/mt (13-Jul), +$92.75/mt (14-Jul). The 8-Jul move followed collapse of the three-week US-Iran ceasefire and resumption of strikes, re-pricing Gulf transit risk after North Sea Dated had fallen to $68/bbl
- The 23-Jul high coincided with Houthi attacks on two Saudi tankers in the Red Sea on 22-23 July, opening a second chokepoint alongside Hormuz; US strikes paused 24-Jul then resumed from 28-Jul
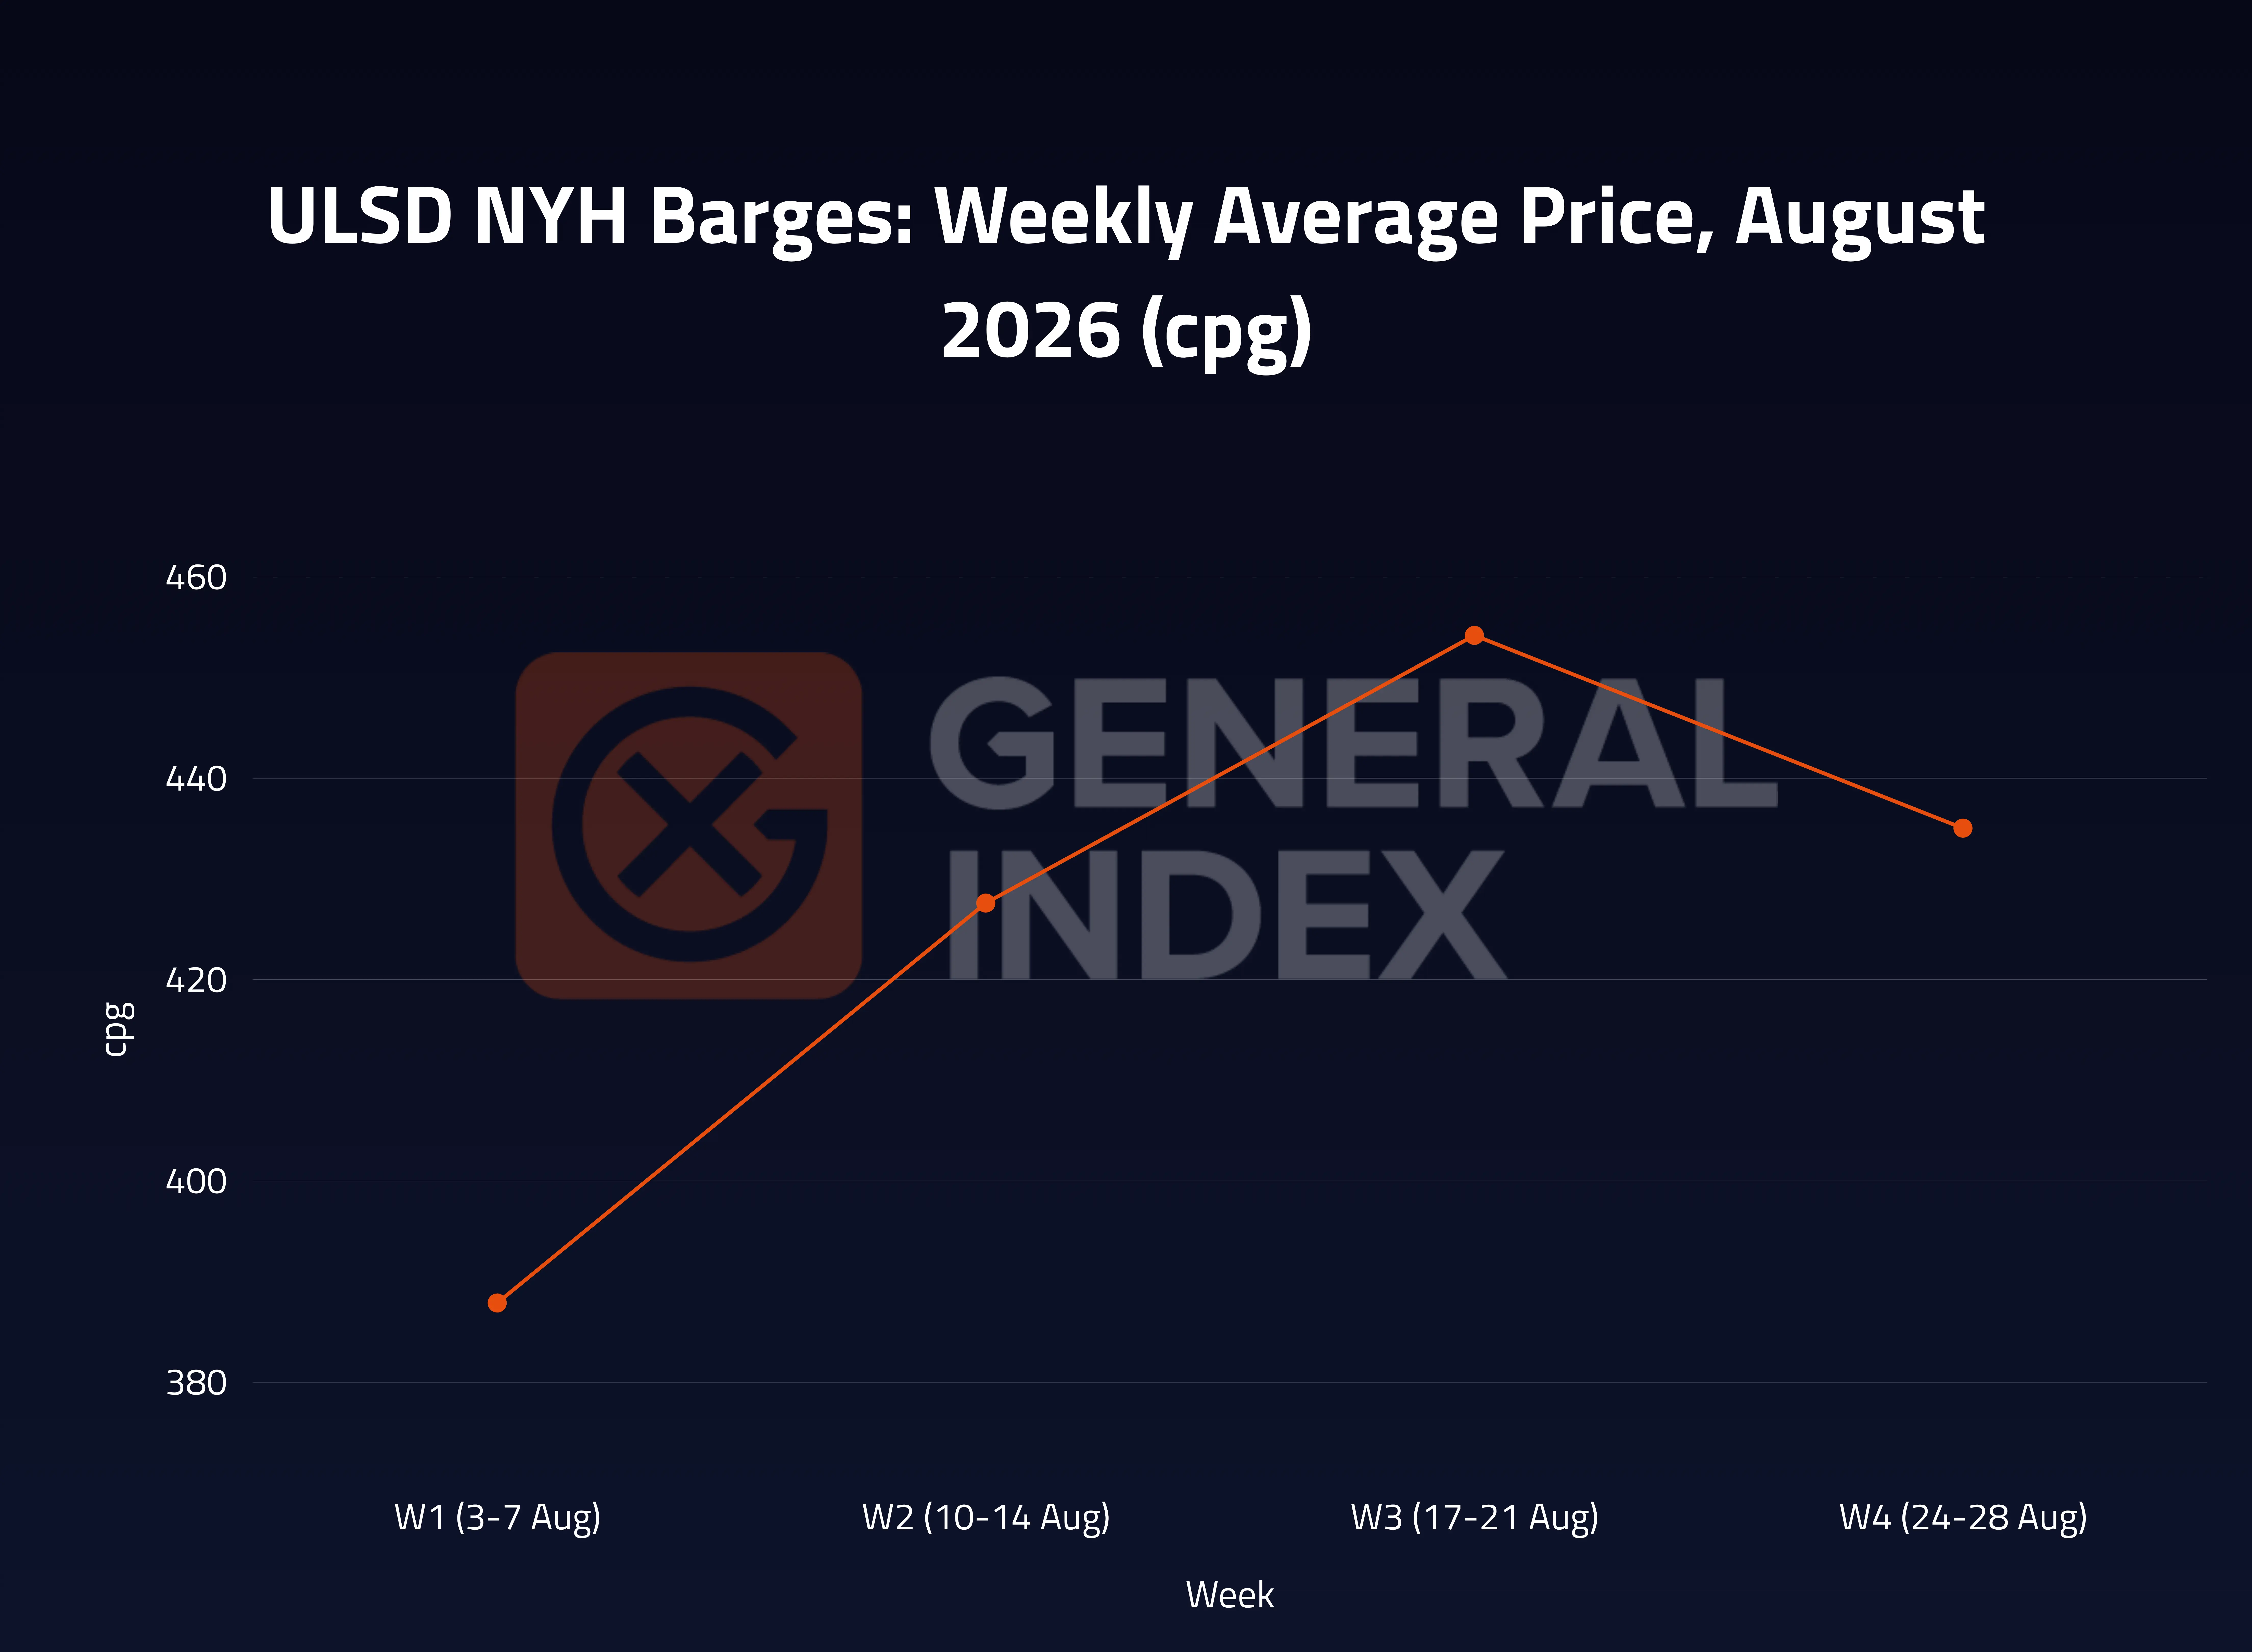
- W5 eased only 1.41% WoW despite strikes resuming, while assessed versus implied widened from -$11.82/mt (23-Jul) to -$53.71/mt (30-Jul): physical disengaged through the re-escalation and the flat price held on paper
CROSS-MARKET DYNAMICS
- Crack vs Dated Brent avg $67.48/bbl vs June $45.49/bbl, closing $74.95/bbl (31-Jul), its monthly high. Product cracks reached four-year highs in early July on a two-sided mechanism: recovering crude supply pushed crude prices lower while product markets stayed tight, with June refinery runs 6 mb/d below year-ago and Middle East export refineries still down (IEA)
- Jet-ULSD regrade fell from -$1.50/bbl to -$6.01/bbl, low -$15.79/bbl (29-Jul). Russia banned diesel exports through 31 July after refinery strikes; loadings fell to 234,000 b/d over 1 to 10 July from about 400,000 b/d in June and a 2025 average near 817,000 b/d (Kpler), lifting diesel specifically and leaving jet the laggard inside its own complex
CROSS-REGIONAL DYNAMICS
- Singapore minus NWE avg -$94.38/mt vs June -$40.93/mt; deepest -$177.07/mt (8-Jul, the escalation session), shallowest -$16.90/mt (14-Jul), close -$142.79/mt
- Singapore jet gained $111.54/mt (+11.3%) against NWE's $158.00/mt (+15.30%). Europe depends structurally on Gulf jet imports and those cargoes remain trapped inside the Strait, making NWE the leg that absorbs escalation first
- CIF over FOB barges avg $12.01/mt vs $4.95/mt, peaking $29.00/mt (24-Jul) then collapsing to $0.25/mt (31-Jul). The import premium topped with the Red Sea attacks.
CURVE STRUCTURE
- Bull steepening: M1-M12 widened $240.50/mt across 23 unbroken sessions of backwardation, though prompt spreads peaked nine days before flat price.
- M1 gained $373.75/mt (+38.6%) against M12's $133.25/mt (+16.4%). M2 gained 37.8%, nearly matching M1, so the steepening concentrated in M6 to M12 rather than detaching the prompt. The curve held M1 > M2 > M6 > M12 on all 23 sessions
- M1-M2 peaked at $57.00/mt (14-Jul) and had narrowed to $32.75/mt by the 23-Jul flat price high, while M1-M12 peaked the same session at $400.25/mt. Prompt backwardation topped nine days before flat price; the final leg was deferred repricing, not prompt scarcity
- The jet-versus-LSGO diff curve ran the opposite way, into deepening contango: M1-M2 from -$3.50/mt to -$41.00/mt, M1-M6 from -$4.50/mt to -$36.75/mt. Jet's premium over gasoil is priced lowest in the prompt and highest in Sep-26 and Jan-27, consistent with a dated diesel distortion sitting in the prompt rather than the deferred
- Implied half daily structure was negative on all 23 sessions, ranging 0.158 to 0.870, against a June series that changed sign seven times and never exceeded 0.342. Its weakest reading came on 23-Jul, corroborating the M1-M2 narrowing into the high
- Assessed versus implied was negative on all 23 sessions, avg -$19.75/mt vs June -$12.04/mt. It converged to -$1.47/mt on 24-Jul, physical validating the move into the high, then widened $52/mt to -$53.71/mt by 30-Jul even as strikes resumed from 28-Jul: physical refused to follow paper through the re-escalation
PRICE VOLATILITY
- Jet CIF CV of 11.70% was the third consecutive monthly rise, from April's 7.23% through 8.39% and 10.19%, stopping just below March's 12.39% peak and running 3.4x February's 3.40% pre-escalation baseline. This is a re-escalating regime, not a single-event spike
- Models calibrated to February's 3.40% understate realized risk more than threefold; 10 to 12% is the working baseline until Hormuz transit normalizes
SOMETHING TO WATCH
- Assessed (physical cash) versus implied (paper) as the physical health indicator:
- Observation: -$53.71/mt (30-Jul), the widest in two months, closing at -$51.36/mt, from -$1.47/mt on 24-Jul
- Why it matters: physical sat $51/mt under paper while strikes were resuming, so the flat price is paper-supported and the unwind risk does not require de-escalation to trigger
- What to monitor: daily assessed versus implied; convergence toward -$20/mt signals physical re-engagement, sustained sub -$50/mt signals the rally has lost its physical base
- Dual-chokepoint risk, Hormuz and the Red Sea:
- Observation: strikes paused 24-Jul and resumed from 28-Jul, with Hormuz transit under 10 commodity vessels a day against roughly 100 pre-war and the Red Sea now a second front after the 22-23 Jul Saudi tanker attacks
- Why it matters: with two routes disrupted, de-escalation on one no longer clears the risk premium; further Red Sea attacks repeat the 23-Jul mechanism directly
- What to monitor: daily Hormuz transit count; Red Sea transit volumes and any further attacks on Gulf or Saudi tanker traffic; any US-Iran talks signal
- Russian diesel export ban expiry:
- Observation: ban ran through 31 July; jet-ULSD regrade averaged -$6.01/bbl with a -$15.79/bbl low, and the M1-M2 diff closed at -$41.00/mt
- Why it matters: expiry unwinds the diesel premium and the diff-curve contango, restoring jet's relative value; extension keeps jet the laggard
- What to monitor: Russian diesel loadings (Kpler); jet-ULSD regrade; M1-M2 diff versus LSGO
Note: All figures, prices and market activity referenced in this report are based on the period covered by this monthly update.
.webp)

.webp)