TTF DA averaged €53.64/MWh in July, up 19.9% month on month, as the de-escalation priced in at the end of June reversed sharply. Every hub covered in this report rose 17.9-21.5% on the month, and unlike June's rally-selloff-partial-recovery round trip, July was a near-uninterrupted climb: renewed US-Iran hostilities around the Strait of Hormuz escalated through the month, the conflict widened into the Red Sea as Iran-backed Houthi forces threatened Saudi Arabia. TTF hit its highest close since January 2023 on 24 July before easing modestly into month-end as Qatar's first LNG tanker in three weeks successfully transited the Strait. EU-wide storage reached roughly 55.4% full by 26 July, continuing steady injections despite the price spike, though still well below the seasonal norm.
PRICE ACTION
- TTF climbed almost without interruption through July, in sharp contrast to June's round trip. Next-day physical opened the month at €42.89/MWh on 1 July and rose in nearly every session thereafter, reaching an intramonth high of €63.21/MWh on 24 July – its highest close since January 2023 – before easing to €58.47/MWh by 30 July. The climb was driven by a sequence of escalations around the Strait of Hormuz: renewed attacks on tankers and US strikes on Iran in early July, an attack on two UAE tankers and a Russian drone strike on Ukrainian gas infrastructure in the middle of the month, and a formal shift by market trackers to a "prolonged crisis" base case in the week of 20-24 July. Only the successful transit of a Qatari LNG tanker through the Strait in the final days of the month interrupted the climb.
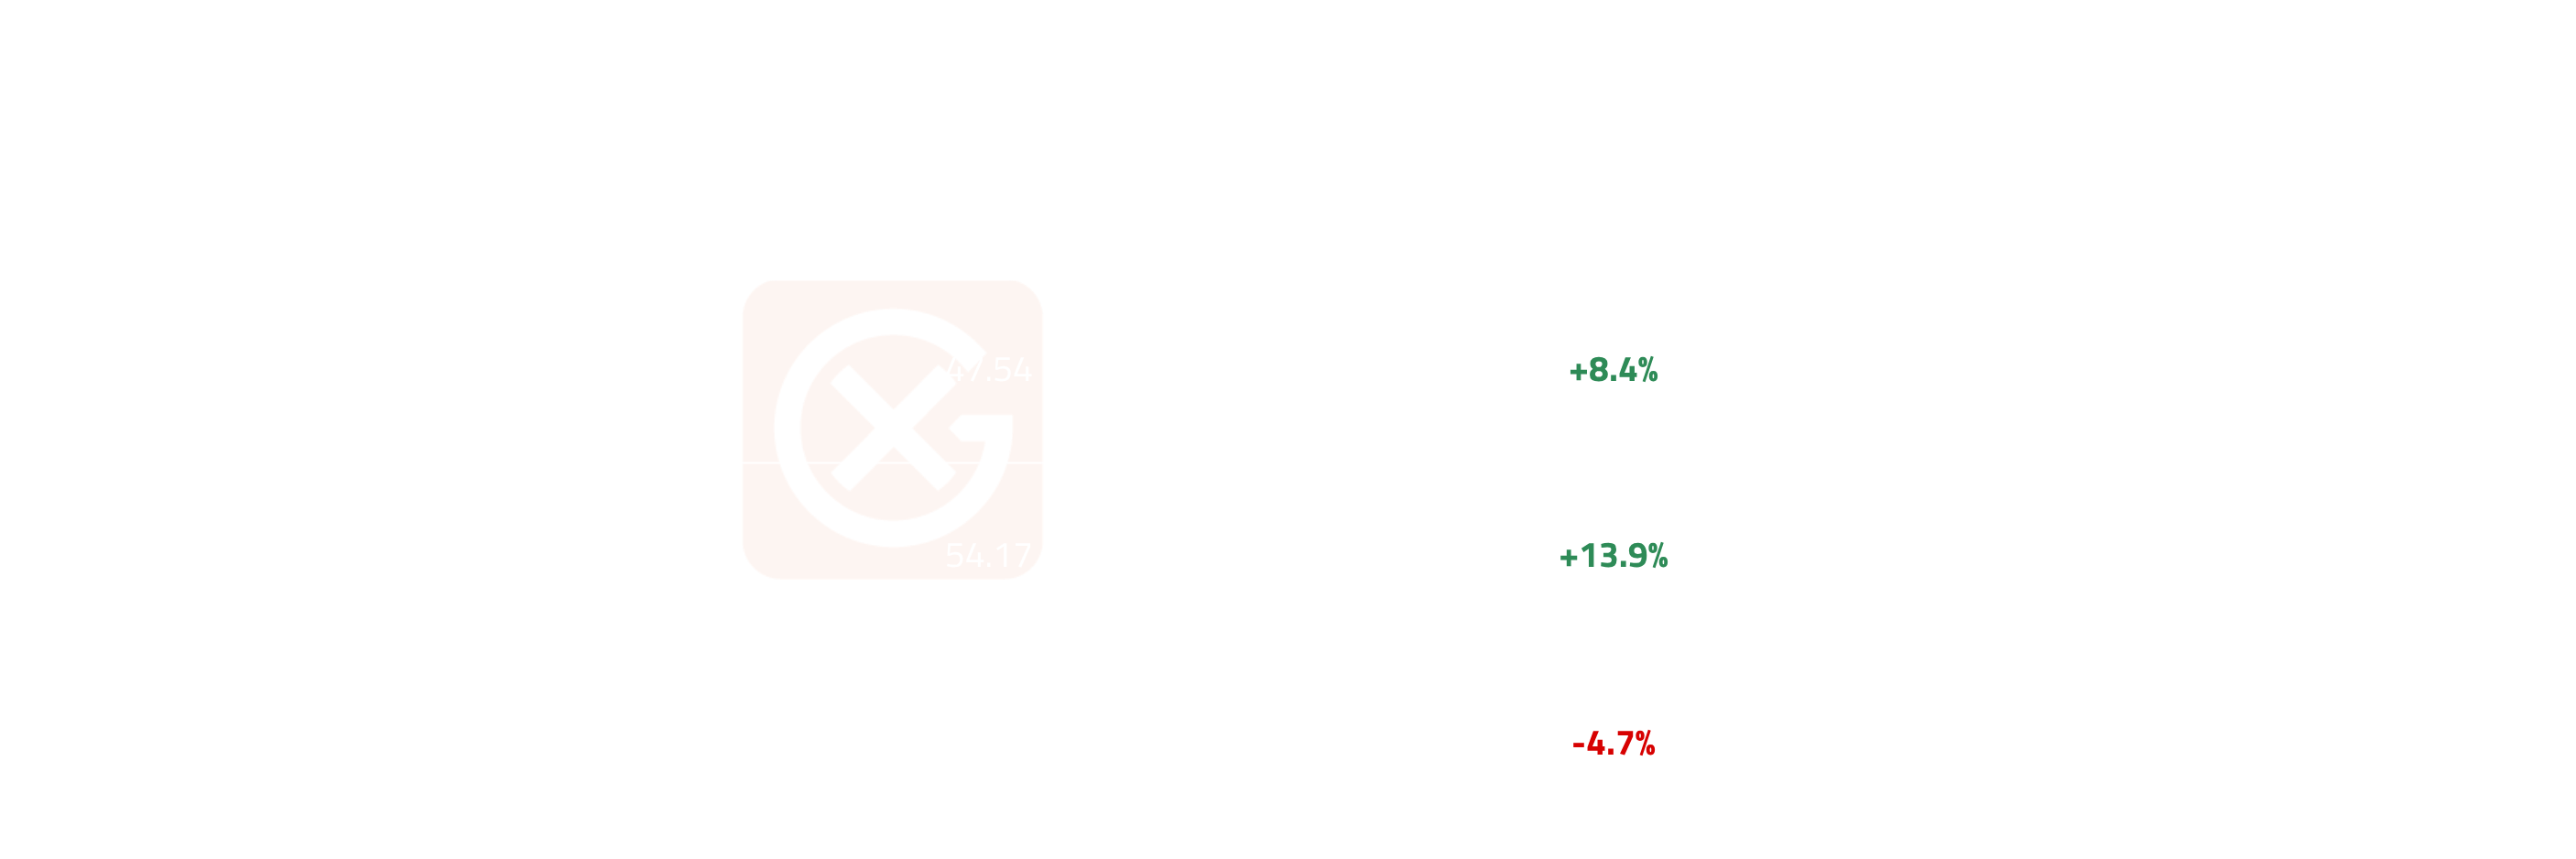
- TTF averaged €53.64/MWh in July, up 19.9% month on month; every other hub in this report rose 17.9-21.5% over the same period.
- The monthly trading range was €20.32/MWh (€42.89 – €63.21), more than double June's range, reflecting a sustained one-directional move rather than a round trip.
- The market strengthened in every week but the last, with the sharpest weekly gains (+13.1-13.9%) coming in the two weeks after the market moved to a prolonged-crisis scenario for the Strait of Hormuz.
- EU-wide gas storage stood at roughly 55.4% full as of 26 July (GIE AGSI+), up from 48.86% at the end of June, with injections continuing through the month despite the price spike, though the market remains well below the seasonal norm for this point in the refill season.
CROSS-MARKET DYNAMICS
- Global LNG competition intensified through July as the Hormuz crisis deepened. Asian spot LNG (JKM) rose in tandem with TTF, reaching roughly $22/MMBtu by 22-24 July – up from the high-$16s/MMBtu in early July – as Kpler cut its Qatari export outlook and shifted to a prolonged-crisis scenario. JKM held a persistent premium to TTF for most of the month, keeping Atlantic Basin cargoes oriented toward Asia, but with Qatari supply itself constrained, the more consequential story in July was less LNG diverted from Europe to Asia than less LNG available to either region at all.
- European gas and oil continued to move together in July, both driven by the same escalating conflict. Brent rose from around $72/bbl at the end of June to above $92/bbl by 30 July as the US and Iran resumed direct strikes – including nine consecutive nights of US strikes on Iran reported around 20 July – and the conflict widened into the Red Sea, where Houthi forces threatened a maritime embargo against Saudi Arabia. Unlike June, which saw a genuine de-escalation take hold by mid-month, July offered no equivalent turning point until the very final days.
CROSS-REGIONAL DYNAMICS
- Basis markets again showed more differentiation than the common price direction, and in some cases extended trends first visible in June.
- CEGH's premium to TTF continued to compress for a second consecutive month, from +€1.30/MWh on 1 July to +€0.84/MWh by 30 July, extending the move seen through June.
- PEG's basis flipped during the month, from a discount to TTF (-€0.31/MWh on 1 July) to a small premium (+€0.05/MWh by 30 July) – a reversal from the persistent discount PEG held throughout June.
- ETF (Denmark) remained the most volatile basis in the dataset, swinging from a small premium (+€0.21/MWh) to as much as -€2.33/MWh intramonth before ending July at -€0.75/MWh.
- ZTP held a tight, stable discount to TTF throughout July (-€0.05 to -€0.19/MWh), while THE carried a small premium all month (+€0.00 to +€0.53/MWh) – both narrower on average than in June.
- TTF and NBP together accounted for 71% of total volume in July, up from 65% in June, an even sharper concentration in the two benchmark hubs; ZTP's and ETF (Denmark)'s volume shares roughly halved over the same period.
- NBP, still quoted in p/therm rather than €/MWh, rose in the same proportion as the Continental hubs (+17.9% month on month) and remained the largest hub by average trade size (2,623 MWh) even as its trade count fell to 1,485 from 1,718 in June.
- Hub-level detail for the month is set out below.
PRICE VOLATILITY
- Volatility rose across every hub in July, and did so uniformly: each hub's Day-Ahead coefficient of variation increased by roughly 4 percentage points versus June, landing in an 11.7-12.7% range in July compared with 7.7-8.6% in June. PEG was the most volatile hub in July (12.65%) and ETF (Denmark) the least (11.67%), but the spread between hubs stayed similarly narrow to June – consistent with a market still being driven by one dominant, shared geopolitical factor rather than hub-specific shocks.
SOMETHING TO WATCH
- Qatari LNG Recovery
- Observation: Kpler shifted its Strait of Hormuz base case from de-escalation to a "prolonged crisis" scenario in late July, pushing back its own expectation for a Qatari LNG recovery; however, a Qatari tanker successfully transited the Strait in the final days of the month for the first time since the attack roughly three weeks earlier.
- Why it matters: A single successful transit is a tentative signal, not confirmation of a trend – but it is the first concrete sign of potential normalization since the crisis deepened, and matters for how much Atlantic Basin LNG Europe needs to compete for against Asian buyers.
- What to monitor: Whether further Qatari tankers transit the Strait in August and the JKM-TTF spread as a gauge of relative Asia-Europe competition for cargoes.
- Storage Through the Injection Season
- Observation: EU-wide storage reached roughly 55.4% full as of 26 July (GIE AGSI+), up from 48.86% at the end of June, continuing steady injections despite the sharp price rise.
- Why it matters: Injections holding up even as prices spiked is a reasonably constructive signal for winter readiness, but the market remains well below the seasonal norm for this point in the refill season, leaving limited room for error if the Hormuz crisis further disrupts supply.
- What to monitor: whether the pace of injections can close the gap to the relaxed 80% target for 1 November as the price rally continues.
- Middle East Risk Persistence
- Observation: The risk flagged in last month's report materialized in full: the US-Iran ceasefire broke down in early July, direct strikes resumed and intensified through the month, and the conflict widened into the Red Sea as Houthi forces threatened Saudi Arabia.
- Why it matters: With the conflict now broader than the Strait of Hormuz alone, and market trackers formally shifting to a prolonged-crisis base case, the range of plausible outcomes for August has widened in both directions – further escalation, or a repeat of the sharp reversal seen after June's memorandum of understanding.
- What to monitor: Strait of Hormuz and Red Sea shipping data, the status of the US-Iran memorandum of understanding, and any signs of renewed diplomatic engagement.
Note: All figures, prices and market activity referenced in this report are based on the period covered by this monthly update.
.webp)

.webp)