In Asia-Pacific, KAU led the complex at +21.6% open-to-close ($14.85 to $18.06) on post-2030 legislative positioning; CEA reached an 18-month high (+16.3% open-to-close, $12.24 to $14.23) on sector-expansion demand despite a softer draft allocation plan; NZU hit a 7-month high (+6.4% open-to-close, $33.61 close) following a government signal defending NZ ETS integrity. In Europe, direction mattered less than policy timing: EUA averaged $91.81/t (+2.17% MoM, +11.88% YoY) and UKA $77.22/t (+3.60% MoM, +18.28% YoY), with UKA the stronger leg at +7.30% open-to-close against EUA's +3.27%. Speculative EUA length had been cut to a two-month low into the 17 July ETS reform package, and the re-entry that followed produced a +5.19% single session on 20-Jul in both series and made W4 (20-24 Jul) the breakout week (EUA +4.63%, UKA +4.69% WoW). Both peaked on 22-Jul, the day a linkage agreement was reported as slipping past the summer, then gave back ground in W5 (EUA -2.50%, UKA -3.33%), with UKA the harder hit. The EUA-UKA spread closed at $14.28/t from $16.67/t at the open, reaching its tightest at $11.83/t on 17-Jul when reform-loosening concern held the EU leg back; three quarters of the $2.45/t re-widening that followed came after 20-Jul as UKA underperformed.
MARKET ACTIVITY
- KAU opened July at $14.85, rallied to a monthly high of $18.06 (31-Jul, +21.6% open-to-close, +10.0% MoM average); the 22 July legislative milestone creating binding post-2030 targets triggered a company-level scramble for domestic offset projects; the July auction cleared at KRW 25,400 (8-Jul, -4.0% vs June's KRW 26,450), below where the secondary market subsequently closed, confirming auction pricing lagged emerging compliance demand.
- CEA advanced from $12.24 to $14.23 (+16.3% open-to-close, +8.5% MoM average), reaching an 18-month high; buying was sustained despite a softer-than-expected draft allocation plan released during the month, with emitters prioritizing coverage ahead of the finalized MEE allocation timeline.
- NZU closed at $33.61 (+6.4% open-to-close, +2.5% MoM average), a 7-month high, driven by a government signal defending NZ ETS integrity following the Golden Bay Cement case.
- ACCU was broadly stable ($26.44-$26.97, +2.0% open-to-close, -0.9% MoM average); the Clean Energy Regulator's release of 13 million units capped upside, limiting price discovery despite structurally supportive demand conditions.
- JCredit Energy Efficiency closed at $31.14 (+3.5% open-to-close, -0.2% MoM average), range-bound at $30.10-$31.14 through the month.
- Speculative EUA long exposure was cut to a two-month low ahead of the 17 July ETS reform package (ICE COT); re-entry after publication drove a +5.19% single session on 20-Jul (EUA $89.46/t to $94.10/t), the largest one-day move of the month in both European series.
- UKA moved +5.19% in the same session ($77.63/t to $81.66/t) and the EUA/UKA ratio held at 1.15 across 17-Jul and 20-Jul, so the move was proportional across both schemes rather than scheme-specific flow.
- UK ETS maritime expansion took effect 1 July 2026, bringing vessels of 5,000 GT and above into scope for in-port emissions with domestic voyages covered in full; UKA's monthly low of $72.89/t was set on that first pricing day and was not revisited, though surrender obligations for the new cohort fall later and no purchasing from it is visible in the data.
- Both schemes set their monthly high on 22-Jul (EUA $97.74/t, UKA $83.07/t) and neither held it; W5 averages fell to $92.45/t and $78.18/t respectively, the reversal coinciding with reporting that a linkage agreement would not come until after the summer.
- European bullets above are positioning and compliance-scope based; no transaction-level bid, offer or counterparty data was pulled for EUA or UKA.
PRICE ACTION
- EUA opened $89.56/t (1-Jul) and closed $92.49/t (31-Jul), +3.27% open-to-close; monthly average $91.81/t vs June's $89.86/t (+$1.95/t, +2.17% MoM) and July 2025's $82.06/t (+$9.75/t, +11.88% YoY).
- EUA high $97.74/t (22-Jul), low $89.18/t (8-Jul); intra-month range $8.56/t vs June's $5.28/t, a 62% wider range in a month whose average moved 2.17%.
- UKA opened $72.89/t (1-Jul) and closed $78.21/t (31-Jul), +7.30% open-to-close; monthly average $77.22/t vs June's $74.54/t (+$2.68/t, +3.60% MoM) and July 2025's $65.29/t (+$11.93/t, +18.28% YoY).
- UKA high $83.07/t (22-Jul), low $72.89/t (1-Jul); the low was the opening print, so UKA was not assessed below its 1-Jul level at any point in the month, while EUA's low came on 8-Jul, ahead of the 17-Jul reform package.
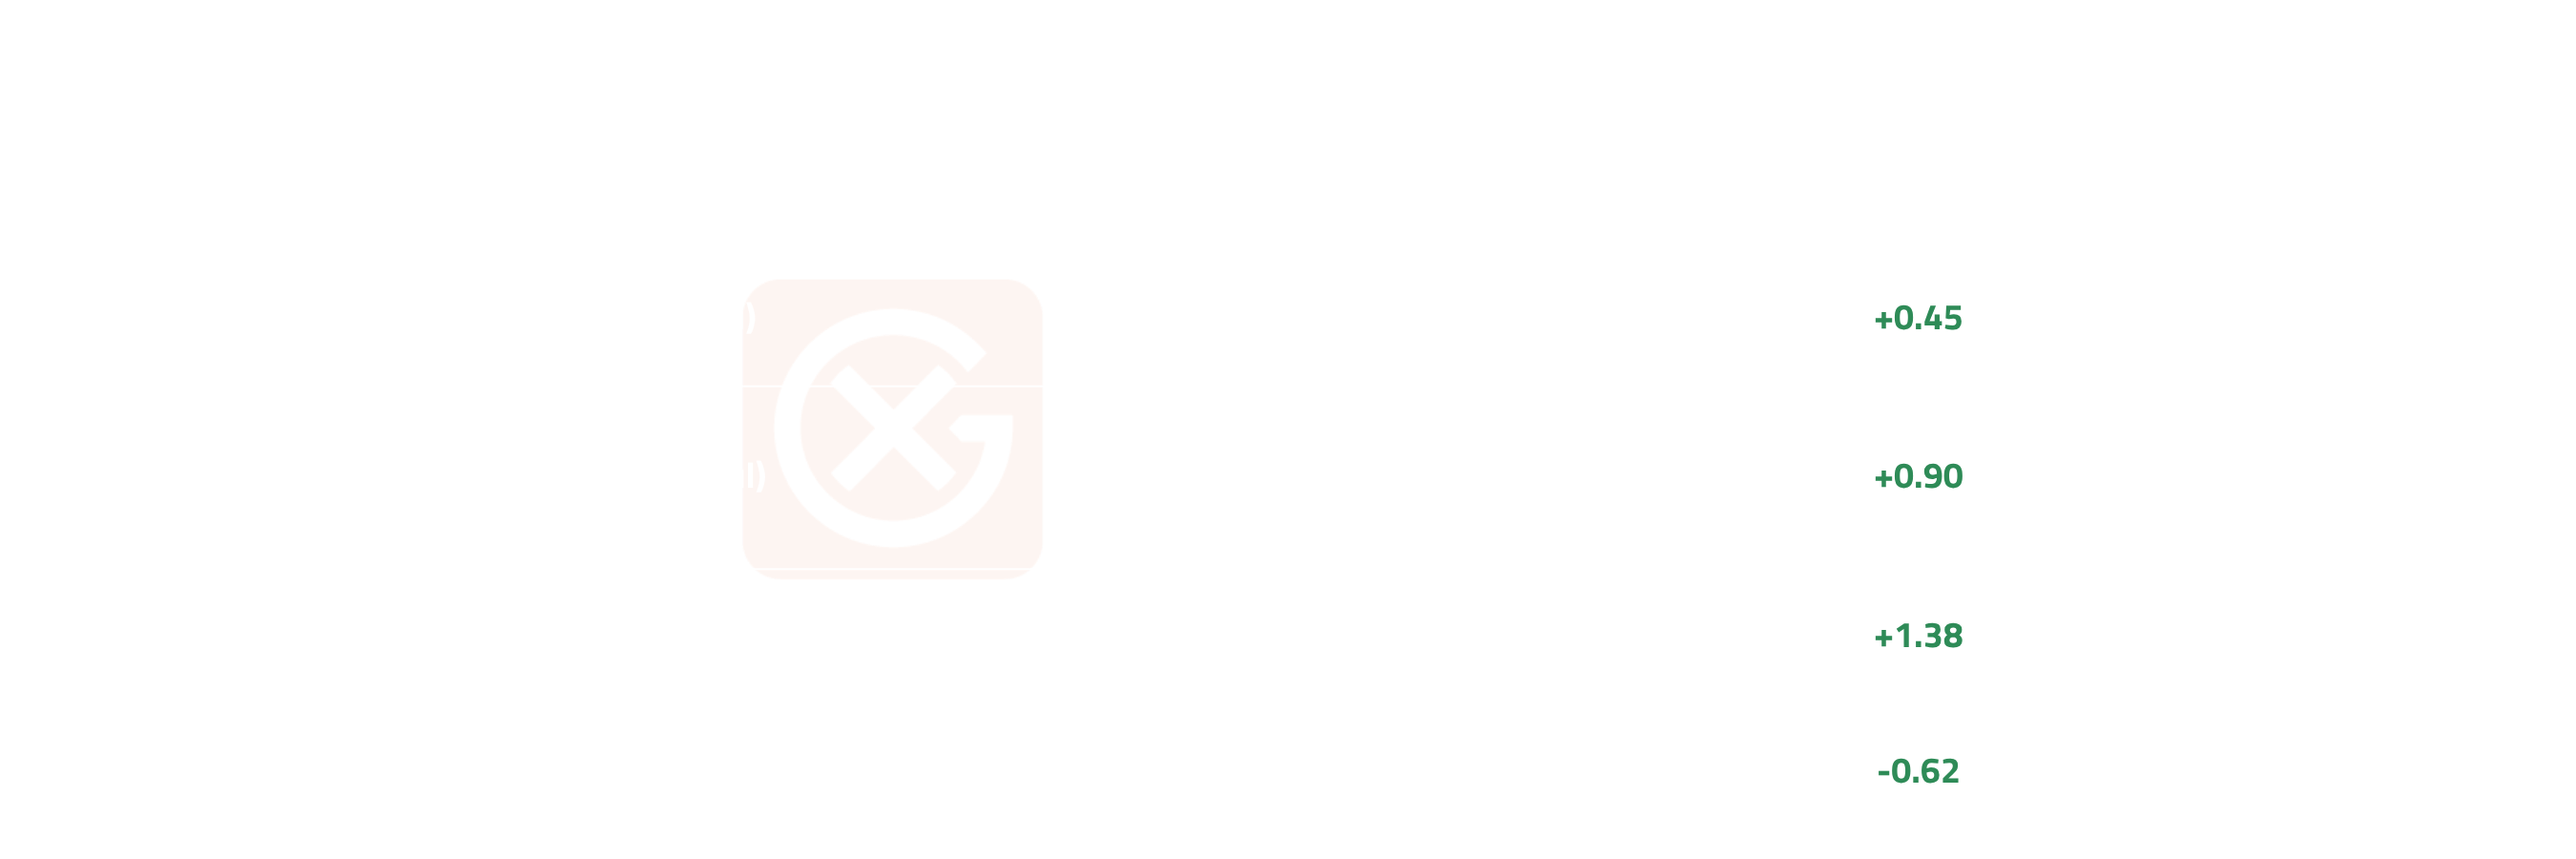
- W4 (20-24 Jul) was the breakout week in both schemes (EUA +4.63%, UKA +4.69% WoW); W5 reversed (EUA -2.50%, UKA -3.33%) and both still finished above their W1 averages.
- CV rose in both schemes off June, the lowest reading of the six months shown (EUA 1.71% to 2.36%, UKA 2.79% to 3.54%); UKA has carried the higher CV in every month since February and both remain well below February's 6.72% and 13.14% readings.
EUA and UKA weekly averages (USD/t)
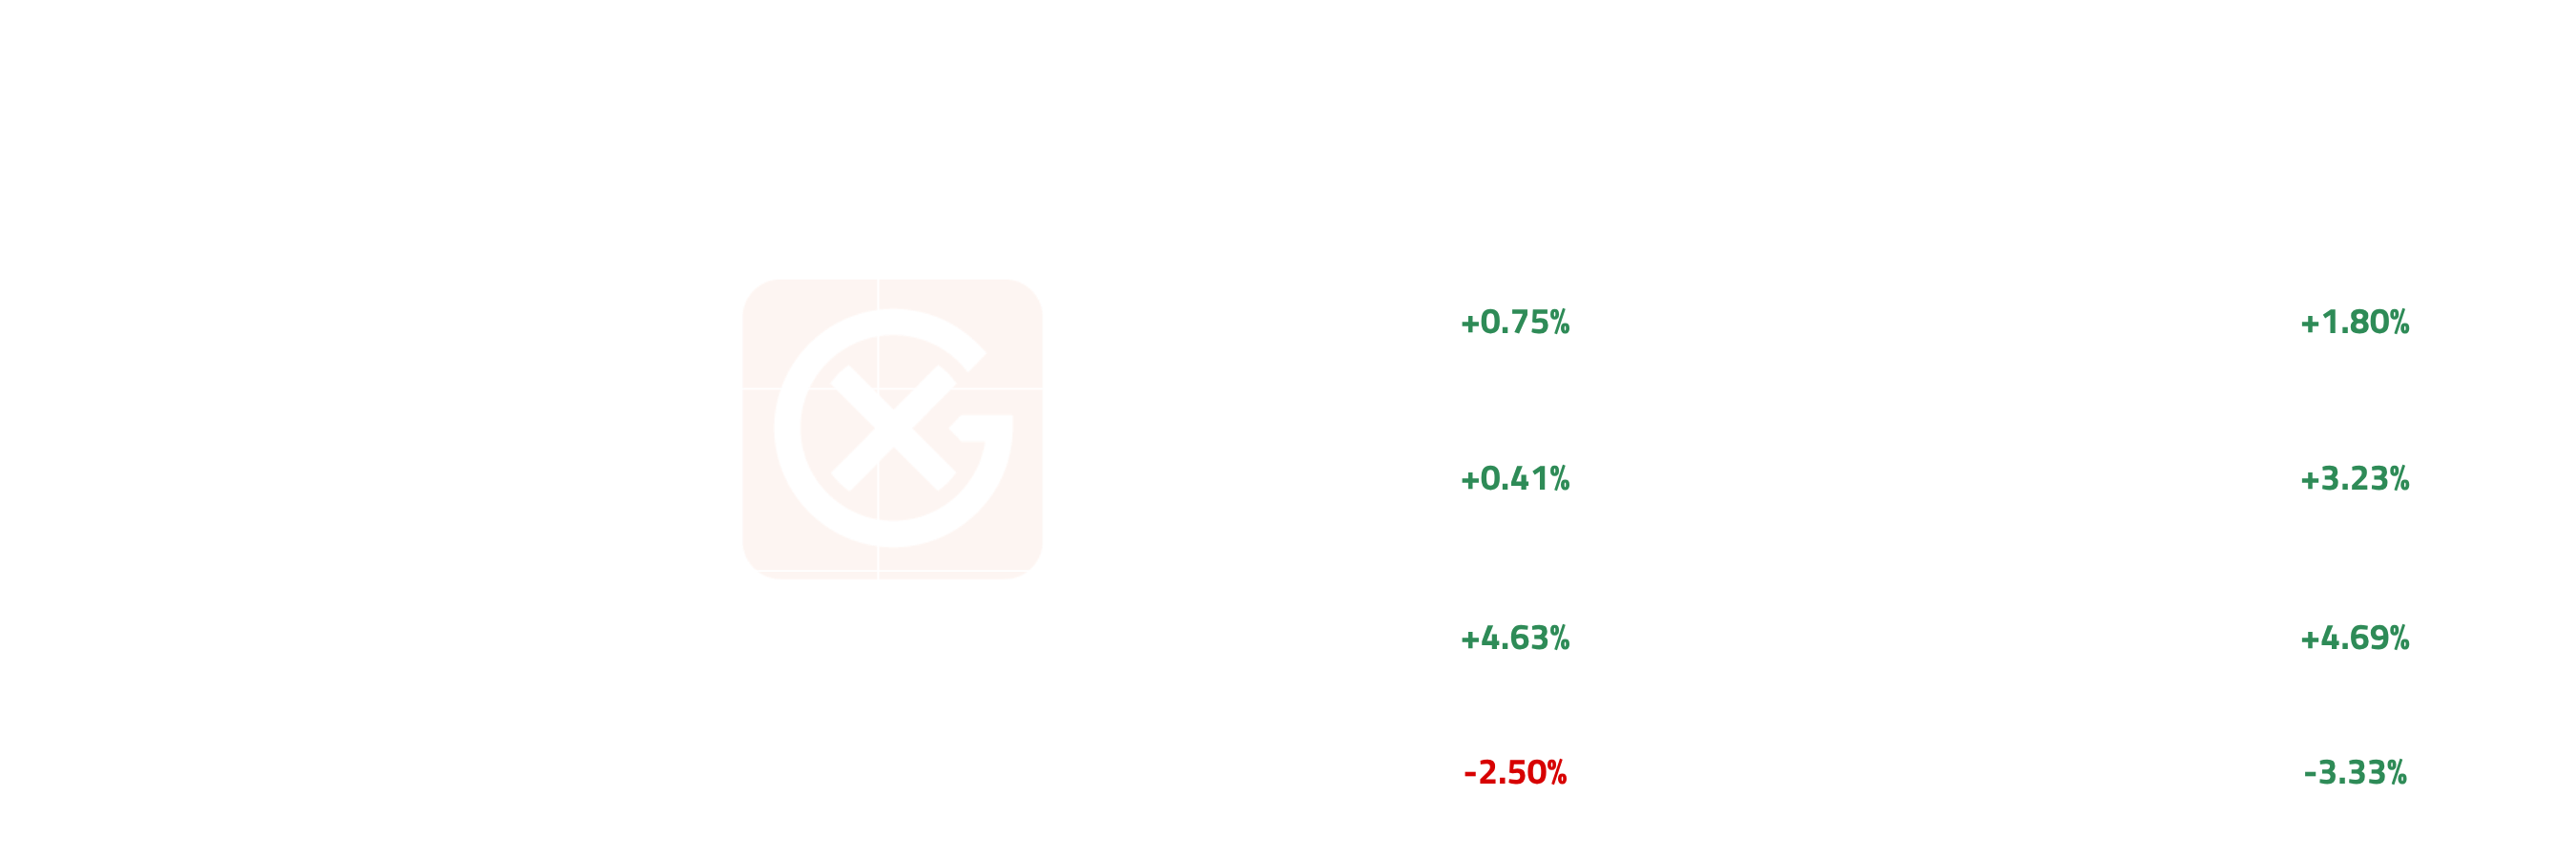
- W1 bucket includes the 29-30 June sessions. Based on 22 EUA and 23 UKA pricing days in July.
Coefficient of variation (%)
CROSS-MARKET DYNAMICS
- Asia Energy-Carbon Volatility Decoupling: KAU's +21.6% open-to-close occurred against a backdrop of broadly soft energy markets, consistent with the energy-carbon decoupling pattern established in June; compliance demand is being driven by regulatory positioning rather than fuel-switching economics, confirming the Asia carbon complex is operating independently of the energy cycle.
CROSS-REGIONAL DYNAMICS
- EUA-UKA spread averaged $14.44/t in July vs $15.32/t in June (-$0.88/t); month-start $16.67/t (1-Jul) to month-end $14.28/t (31-Jul), a $2.39/t compression, with the EUA/UKA ratio falling from 1.23 to 1.18.
- The tightest print was $11.83/t on 17-Jul, the day the ETS reform package landed, with reform-loosening concern holding the EU leg back while the UK leg rose; the spread then re-widened $2.45/t into month-end.
- That re-widening splits in two. From 17-Jul to 20-Jul it added $0.61/t with the ratio unchanged at 1.15, both legs moving +5.19%, so the dollar gap widened on the level difference alone rather than on relative performance.
- From 20-Jul to month-end it added a further $1.84/t as the ratio moved 1.15 to 1.18, W5 UKA underperformance (-3.33% vs -2.50% WoW) doing the work; that $1.84/t is the part of the discount carrying linkage expectation, and it returned once an agreement was reported as slipping past the summer.
- UKA still closed with more ground gained than EUA (+7.30% vs +3.27% open-to-close) and a discount $2.39/t narrower than at the open, so the convergence bid survived the slippage; that it gave back more than EUA in W5 rather than holding indicates linkage expectation, not the 1-Jul scope change, sets the marginal bid.
DATA & POSITIONING
- The EUA December strip held contango across all six listed vintages and steepened through July: front December $90.54/t to $93.33/t (+$2.79/t, +3.08%), Dec+5 $107.34/t to $112.15/t (+$4.81/t, +4.48%); front-to-Dec+5 widened from -$16.80/t to -$18.82/t.
- UKA lists three December vintages and steepened on the same shape: front $74.19/t to $79.58/t, Dec+2 $81.76/t to $87.90/t; front-to-Dec+2 widened from -$7.57/t to -$8.32/t.
- Deferred vintages outran the front in both schemes, so July's rally was priced further out the curve than at the prompt; the move fits none of the six named curve patterns (the front neither fell nor held still) and is reported as data rather than classified.
- The cost of rolling coverage down the strip rose: the front-December to Dec+5 premium widened $2.02/t across the month in EUAs and the front-to-Dec+2 premium widened $0.75/t in UKAs, so a buyer extending cover at month-end paid more over the front contract than one extending at month-start.
December vintage curve, month-start to month-end (USD/t)
SOMETHING TO WATCH
- California cap-and-invest overhaul as a structural catalyst: CARB confirmed in its latest report to the state legislature that the Cap-and-Invest program was revised earlier this year to accelerate emissions reductions toward California's 2030 target, tightening the pace at which carbon allowances shrink over time, with the new schedule taking effect later this year; since this is a structural, multi-year shift rather than a near-term catalyst, it's worth monitoring any further regulatory guidance from CARB and the next quarterly auction for signs of how the market absorbs the tighter schedule going forward.
- KAU allocation plan: the August KAU auction bid coverage ratio is the first quantitative read on whether the 22 July post-2030 legislative milestone has materially shifted compliance demand; watch for the finalized Phase 4 free allocation percentages per sector as the trigger that either sustains KRW 24,000+ or drives a correction.
- CEA draft allocation plan: the finalized MEE allocation plan is the next structural catalyst — a tighter-than-draft outcome confirms the 18-month high; a plan in line with the softer draft signals near-term consolidation below $14.00.
- EUA-UKA spread as the linkage probability gauge:
- Observation: spread closed at $14.28/t after touching $11.83/t on 17-Jul; ratio 1.18 at close vs 1.24 at the June open. The summit expected to carry the linkage agreement was postponed in late June on the change of prime minister and did not take place in July; the two sides are reported to be targeting one by year-end.
- Why it matters: the discount carries linkage expectation, so a sustained move back below $12/t would signal a year-end summit being taken seriously, while a widening through $16.67/t (the 1-Jul level) would price slippage into 2027 and unwind the convergence bid.
- What to monitor: confirmation of a new summit date; the daily EUA/UKA ratio against its 17-Jul level of 1.15 and the 1.24 June open; the UK political timetable, given the summit slipped on a leadership change.
- September ETS revision decision as the next EUA catalyst:
- Observation: member states were asked on 22 July to reflect over the summer on the ETS revision proposal, with a September decision targeted on a separate proposal covering fallback benchmarks.
- Why it matters: EUA positioning sat at a two-month low into the 17-Jul package and the session that followed was +5.19%, the month's largest; a September decision presents the same setup once rather than a proven pattern, and that session is the order of magnitude available if the outcome again reads tighter than positioning.
- What to monitor: the September Council decision on fallback benchmarks; weekly speculative positioning into it; whether EUA CV holds July's 2.36% or reverts toward June's 1.71%, the lowest of the six months shown.
Note: All figures, prices and market activity referenced in this report are based on the period covered by this monthly update.
.webp)

.webp)