U.S. natural gas prices declined through July as strong production continued to outweigh demand from above-normal summer temperatures. Henry Hub came under pressure after falling below $3/MMBtu early in the month, while reduced LNG feedgas demand during Freeport LNG's maintenance added to the weaker market tone. Regional pricing reflected local infrastructure and weather conditions, with Waha strengthening as additional Permian takeaway capacity eased transportation constraints and Algonquin Citygate spiking during periods of Northeast heat before retreating. Although weather supported short-term price swings, production remained the dominant driver of market direction.
PRICE ACTION
- Open/Close: Henry Hub opened $3.3448 (Jul 1), closed $2.5897 (Jul 31), monthly average $2.887 vs June's $3.146 (–8.24% MoM avg, –$0.259) vs July 2025's $3.171 (–8.97% YoY avg, –$0.284); close-to-close, July fell 21.91% MoM and 13.31% YoY
- Range: Monthly high $3.3726 (Jul 2), monthly low $2.5285 (Jul 28); intra-month range $0.8441, up from June's $0.447 range
- Single-day move: Largest move Jul 10, –$0.3915 (–12.37%), from $3.1639 to $2.7724, as the contract broke below the psychologically important $3/MMBtu level after 30 consecutive sessions above it; the decisive break signaled a shift from a weather-driven bullish narrative toward one centered on comfortable supply and softer demand expectations
- Read-through: The monthly low was set Jul 28 ($2.5285), just three sessions before the Jul 31 close ($2.5897); the month ended near its lows rather than rebounding, suggesting the downtrend had not found a durable floor
SUPPLY AND STORAGE FUNDAMENTALS
- Weekly build: Working gas inventories rose 32 Bcf to 3,056 Bcf for the week ended Jul 17, coming in below the ~34 Bcf analyst consensus; stocks stood 183 Bcf above the five-year average of 2,873 Bcf and 16 Bcf below year-ago levels
- Regional breakdown: East +17 Bcf, Midwest +17 Bcf, South Central +2 Bcf, Mountain unchanged, Pacific –5 Bcf; the build was not exceptional in isolation but reinforced that production continues to outpace aggregate demand despite elevated summer cooling loads
- End-of-October outlook: Storage is projected to reach 3,966 Bcf by end-October, 5% above the five-year average, supporting expectations of a comfortable entry into the winter withdrawal season if current injection rates persist
CROSS-REGIONAL DYNAMICS
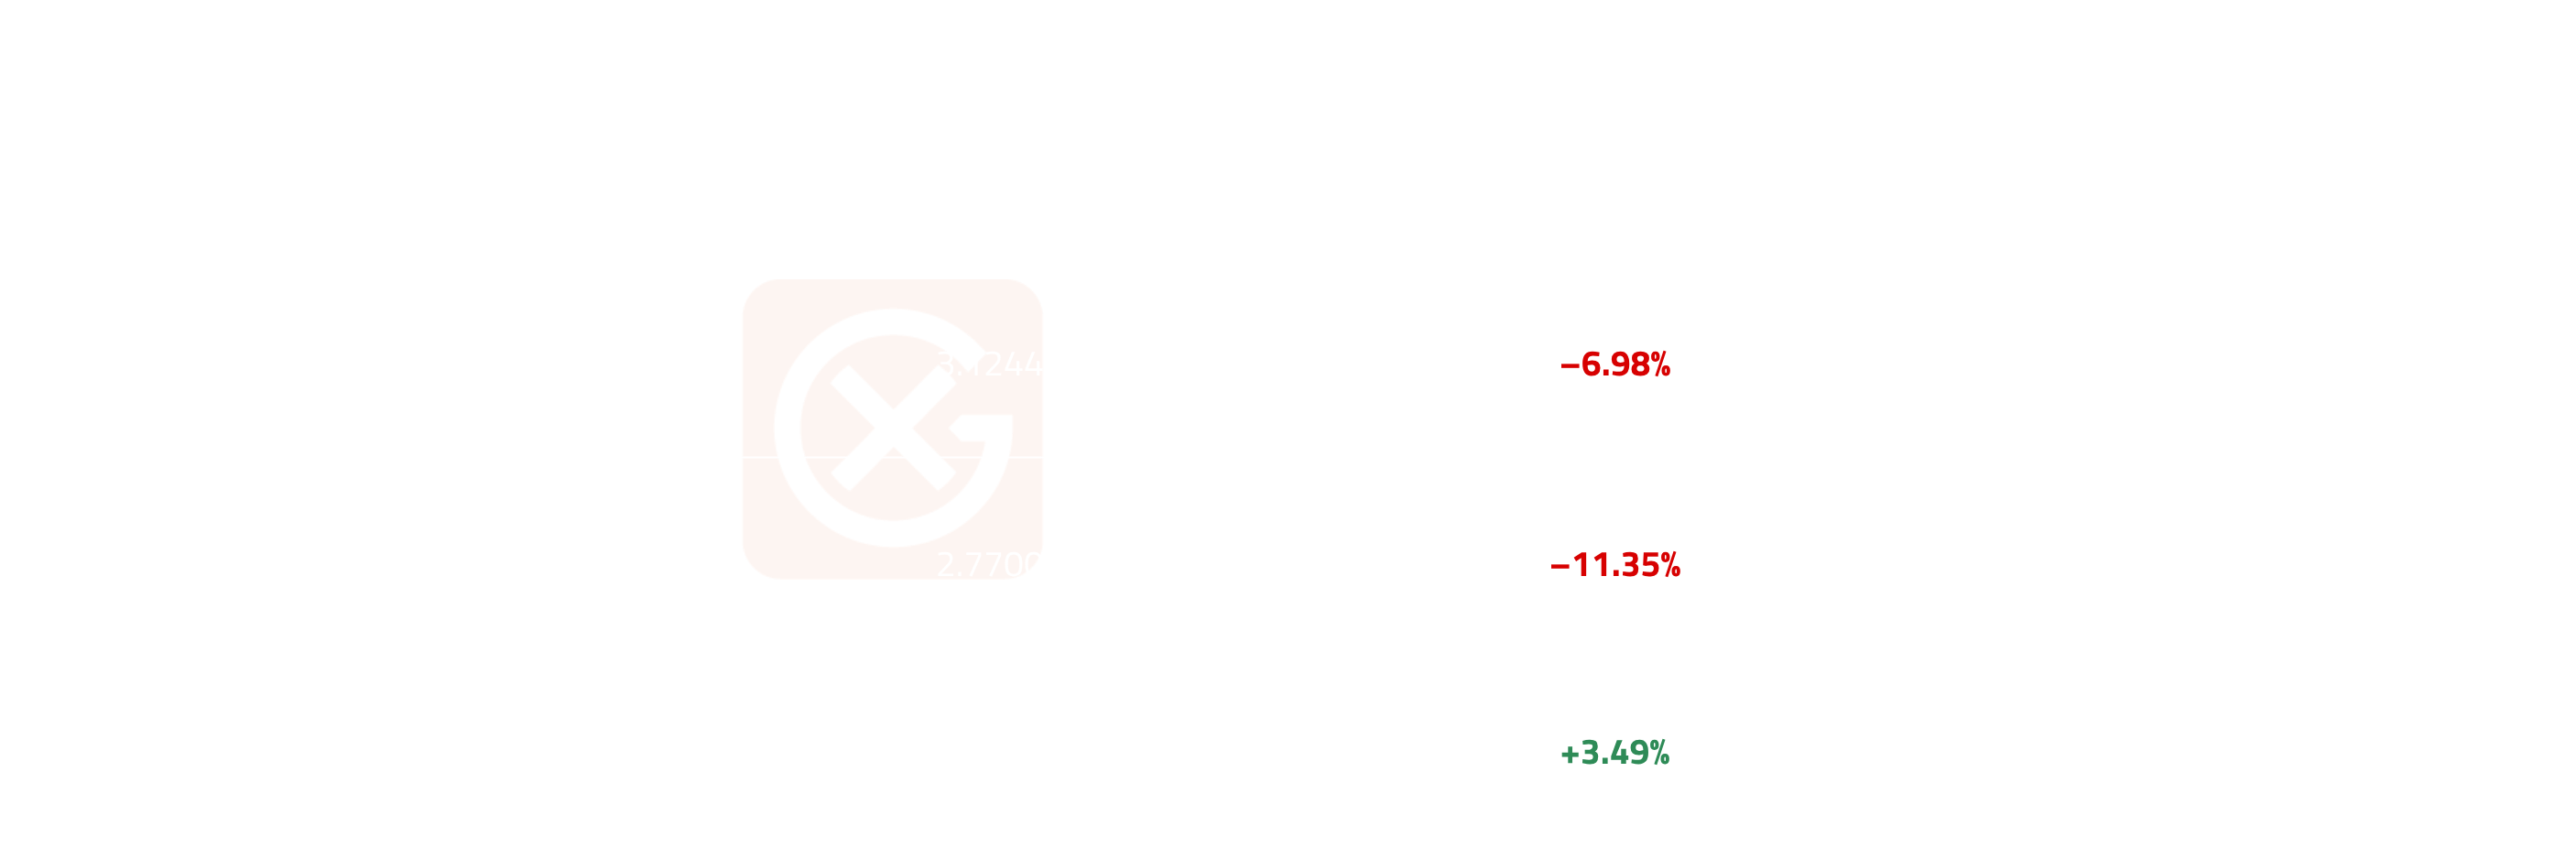
- Waha: HH-Waha spread compressed from +$2.934 avg (June) to +$1.136 avg (July), –61.3% MoM, as Waha held positive for a second consecutive month; the Gulf Coast Express expansion (~600 MMcf/d) and initial flows on Energy Transfer's Hugh Brinson Pipeline are structural relief, not a one-month event
- Algonquin: HH-Algonquin spread compressed 47.8% MoM to +$0.223 avg; Algonquin spiked to $4.9667 (Jul 1) and $4.1329 (Jul 14) on Northeast heat events, briefly flipping Henry Hub to a $1.62 and $1.32 discount on those two days before Algonquin eased back for the balance of the month
- Gulf Coast stability: HH-Houston SC and HH-Katy were essentially flat MoM (–$0.001 and –$0.008, respectively), holding in a tight $0.125–$0.782 band all month; both Gulf Coast hubs tracked Henry Hub almost one-for-one even as Henry Hub itself fell, consistent with a well-supplied, storage-buffered region
- Midwest: HH-Chicago Citygate compressed 38.0% MoM to +$0.277 avg, briefly narrowing to +$0.007 on Jul 13, the tightest print of the period, as Henry Hub's own decline outpaced a Midwest hub whose heat-wave move stayed modest
PRICE VOLATILITY
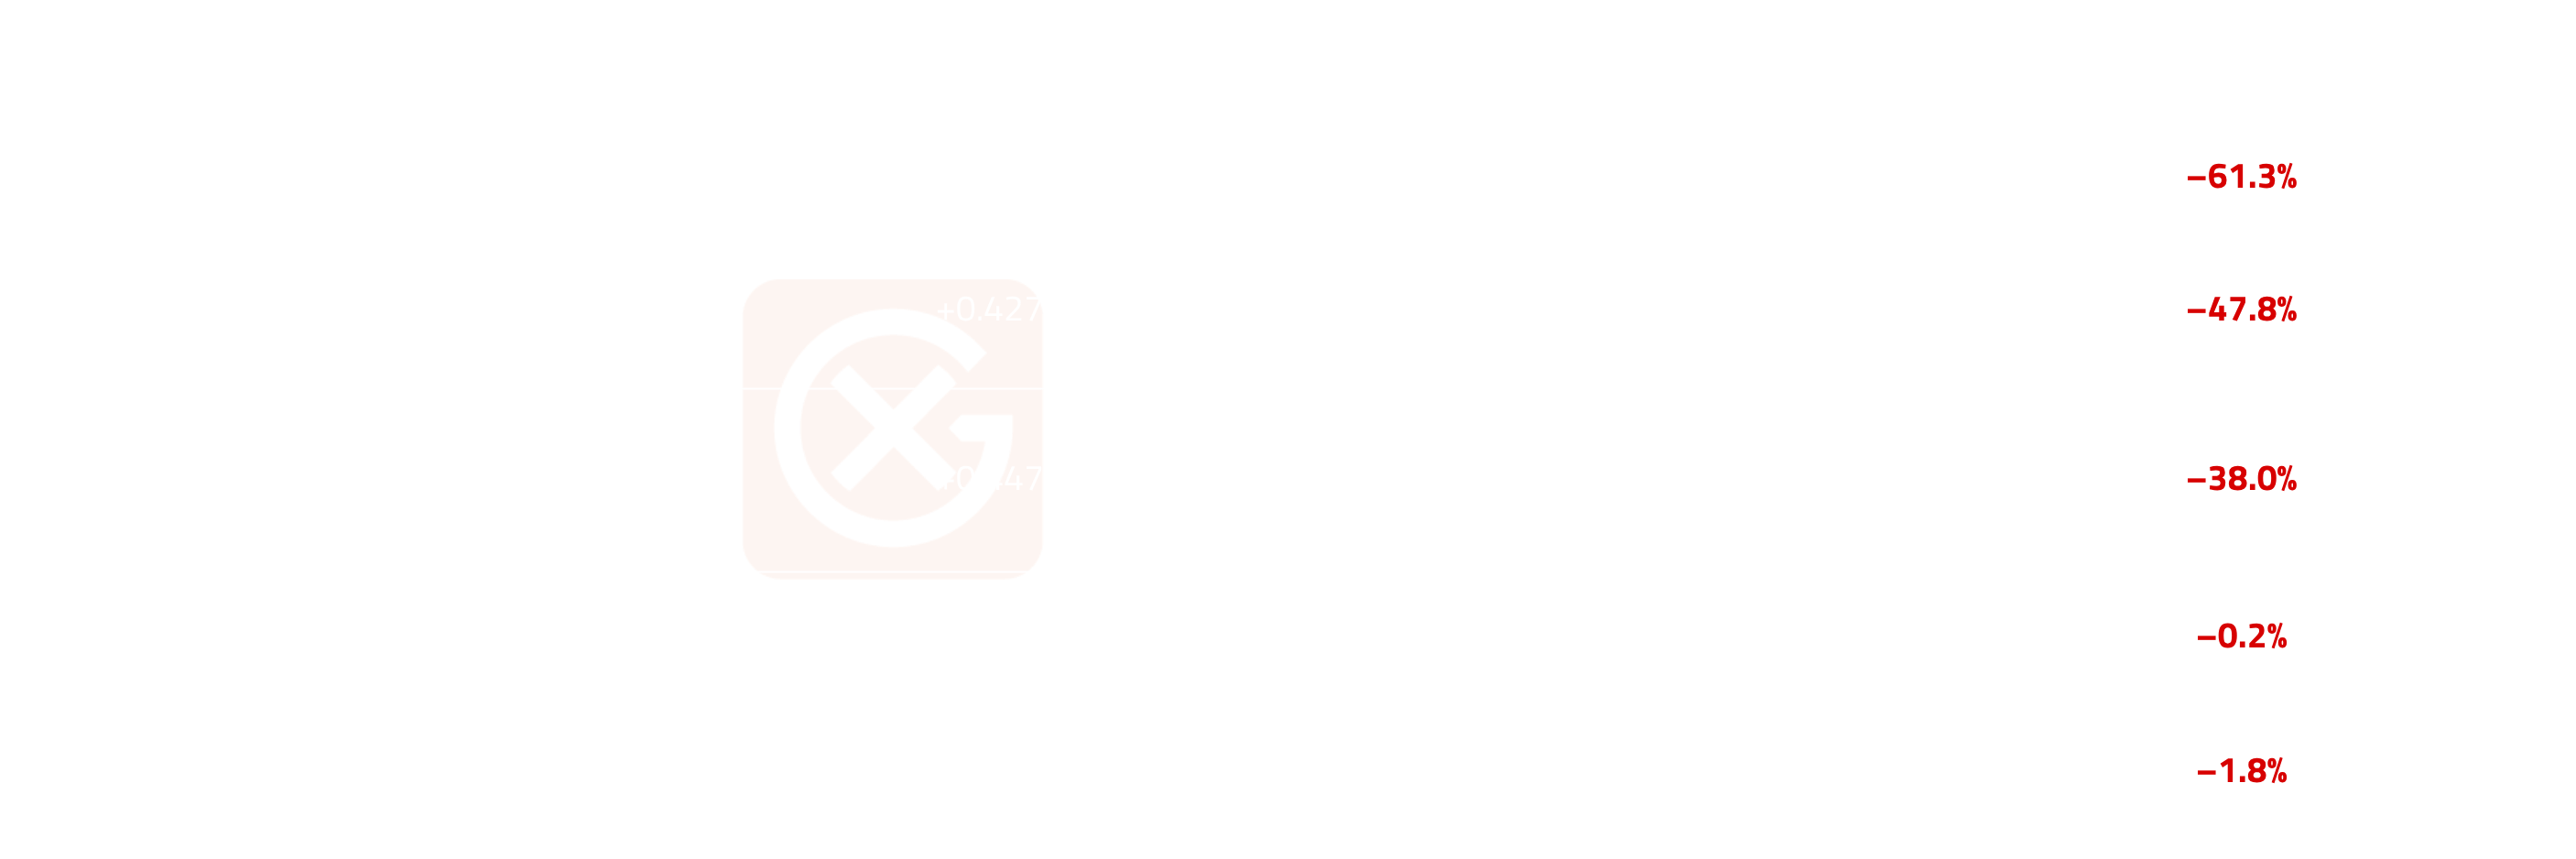
- Henry Hub: CV rose to 9.15% in July from 3.79% in June, more than doubling MoM; second only to February's 19.74% in the six-month window
- Algonquin: CV registered 28.29% in July vs 16.39% in June, and has exceeded 14% in five of the last six months (Feb 59.75%, Mar 29.04%, May 33.52%), a structurally volatile hub rather than a July-specific event
- Stable hubs: Chicago Citygate, Houston SC, and Katy each posted single-digit CVs (4.62%, 6.03%, 5.47%), little changed from June, reinforcing the Gulf Coast/Midwest stability seen in the spread data
- Waha excluded: June's near-zero mean ($0.212) produces a mathematically meaningless 610% CV; July's recovered mean ($1.751) restores an interpretable 24.92%, still elevated as the hub transitions off its multi-year negative-basis regime
- Implication: A falling flat price alongside rising volatility is the hedging-relevant read: risk models calibrated to March-June's 3–4% range are underestimating current risk by roughly 2.4x
- Read-through: The combination of declining flat prices and increasing volatility indicates traders continued to price meaningful short-term weather and LNG risk even as broader fundamentals stayed bearish
WEATHER, PRODUCTION AND LNG DEMAND
- Cooling demand: Electric-customer-weighted cooling degree days ran 39.4% warmer than the 30-year normal for the week ended Jul 4, consistent with a warm summer overall
- Production: 2026 dry gas production is projected to average 111.2 Bcf/d, near record levels for the year; strong output limited the market's ability to respond to persistent summer heat and reinforced expectations that supply would stay ample
- LNG feedgas: National LNG feedgas deliveries averaged about 17.4 Bcf/d month-to-date in July through Jul 22, essentially flat versus June's 17.5 Bcf/d average
- Heat/price disconnect: Much of the U.S. saw above-normal temperatures supporting gas-fired power demand, yet the market largely looked past the heat because stronger production, healthy inventories and weaker LNG demand dominated pricing; that disconnect was one of July's defining themes
SOMETHING TO WATCH
- Market direction into the shoulder season depends primarily on four variables: the pace of LNG feedgas recovery following Freeport maintenance, weekly storage injections, Lower 48 production trends, and the persistence of late-summer heat across major consuming regions. Comfortable storage projections continue to limit upside price risk, but any combination of stronger LNG demand, production disruptions, or sustained heat could tighten balances and increase volatility. Conversely, continued above-average production combined with seasonal moderation in weather would likely keep Henry Hub under pressure into the shoulder season.
- LNG feedgas demand recovery
- Observation: National feedgas deliveries have held roughly flat month-to-date at 17.4 Bcf/d vs June's 17.5 Bcf/d
- Why it matters: The outage removes a meaningful source of domestic demand just as storage stays ample; a return to normal feedgas rates would restore that demand pull and could re-tighten the market into the shoulder season
- What to monitor: Freeport LNG's maintenance completion date; weekly LNG feedgas nomination data
- Weekly storage injections
- Observation: Inventories rose 32 Bcf to 3,056 Bcf for the week ended Jul 17, below the ~34 Bcf analyst consensus but within the five-year historical range, 183 Bcf above the five-year average
- Why it matters: A sustained run of below-average builds would narrow the cushion embedded in the 3,966 Bcf end-October storage projection, removing one of the main anchors keeping Henry Hub under pressure
- What to monitor: Weekly storage report (Thursdays); injection pace versus the five-year average
- Lower 48 production trends
- Observation: 2026 dry gas production is projected to average 111.2 Bcf/d, near record levels for the year
- Why it matters: Any disruption or plateau in production growth would remove the main offset to elevated summer power-burn demand, shifting the market from a supply story back to a demand story
- What to monitor: Weekly dry gas production estimates; any reported outages or curtailments
- Persistence of late-summer heat
- Observation: Weather ran 39.4% warmer than the 30-year normal for the week ended Jul 4; Algonquin Citygate spiked twice on Northeast heat events (Jul 1 to $4.97, Jul 14 to $4.13) before easing back to a small Henry Hub premium of $0.147 by month-end
- Why it matters: Pipeline-constrained regional hubs like Algonquin remain highly sensitive to short-lived heat events; a renewed or prolonged heat wave before the shoulder season could reproduce that spike-and-reverse pattern at a national level, not just regionally
- What to monitor: NOAA's extended temperature outlook; daily Algonquin Citygate cash prints
Note: All figures, prices and market activity referenced in this report are based on the period covered by this monthly update.
.webp)

.webp)