Eurobob Oxy E5 averaged $1,099.85/mt in May, up 8.6% MoM and 65.7% YoY, but the path tells a different story than April: a V-shaped month that opened at $1,096/mt, peaked at $1,174/mt on 18-May as Hormuz remained shut and US-Iran talks stalled, then crashed -11.0% over W5 to close at $974.75/mt on 27-May after Axios reported the two sides had reached a 60-day MOU to extend the ceasefire. Gasoline outperformed every other product in the barrel: the E5 vs Brent crack averaged $25.39/bbl (April: $2.62/bbl) — the largest gasoline-specific crack expansion of the cycle — while ULSD's crack stayed flat at $49.17/bbl, sharpening refiners' yield incentive toward gasoline as peak driving season approached.
The forward curve flipped from bull steepening to front collapse: M1-M6 narrowed $108.25/mt (278.25 → 170.00) as the prompt led the late-month selloff while the back held. The IEA's May OMR named July-August the "red zone" — peak driving demand meeting sustained 14 mb/d of Gulf supply loss with only ~416 mb of inventory cushion drawn since end-Feb — while flagging -1.2% global gasoline demand contraction in 2026 from high-price demand destruction. Reopening unwinds the crack and the front first; sustained closure into June re-tests the May high and pulls the back curve with it.
Market Activity
- 310 total transactions across Eurobob Oxy and 95 RON NWE FOB Barges (1 bid, 3 offers, 306 trades) vs April's 294 (+5.4% MoM); the near-pure-trade composition (99% trades, vs the April template's 96%) indicates participants cleared positions rather than probing prices through the window.
- Totsa retained top-buyer position (185 trades) vs April 201; consumer-trader Varo second (32, unchanged role from April's 20), Exxon third (30), Trafigura fourth (27); the buy-side concentration sustained the demand-pull signal from April even as crude pared its risk premium.
- BP led the sell side (141 trades) vs April 87; the 62% increase in BP offers month-on-month is the cleanest participant signal — producer-major lengthening its sell-side presence into the late-month rally and meeting it at the top, consistent with hedging the W3-W4 peak above $1,170/mt.
- Shell second seller (47, up from 23) and Equinor fourth (26, down from 38); producer-major sell-side share (BP+Shell+Equinor+Exxon producer-trader) rose meaningfully, the classic "producers offloading into the rally" pattern that often precedes a flat-price top.
- Trafigura returned to the top five as third seller (42) after exiting April's top five; the intermediary rejoining the offer stack alongside producer sellers helped clear the W5 selloff and is consistent with the front-collapse curve move.
Price Action
- E5 opened $1,096/mt (1-May), closed $974.75/mt (27-May), avg $1,099.85/mt vs April $1,013.11/mt (+$86.74/mt MoM, +8.6%; +65.7% YoY); 17 trading days.
- Monthly high $1,174/mt (18-May) as Trump halted "Project Freedom" Strait escort op (6-May) failed to translate into a deal and Hormuz remained shut; monthly low $974.75/mt (27-May); intra-month range $199.50/mt vs April's $216.25/mt.
- Largest single-day move: -$81.25/mt on 6-May (-7.0%) after Trump suspended the US Navy escort operation citing diplomatic progress; the market initially read this as a path to reopening before the rally resumed mid-month on stalled talks.
- W5 (25-29 May) averaged $1,017/mt (-11.0% WoW) on the Axios 60-day MOU report; the close at the monthly low — not a rally back into Friday — signals the market priced the MOU as credible rather than fading the headline.
Cross-Market Dynamics
- E5 vs Brent crack (Prompt) averaged $25.39/bbl in May vs $2.62/bbl in April (+$22.77/bbl); closed $17.73/bbl after touching the monthly high of $28.95/bbl on 11-May — this is the largest gasoline-specific crack expansion of the cycle and the cleanest signal that May was a gasoline story, not a crude story.
- ULSD vs Brent crack flat at $49.17/bbl (May) vs $47.84/bbl (April), +$1.33/bbl MoM; the contrast with the gasoline crack tells refiners exactly which yield to chase — gasoline-distillate yield economics swung sharply in gasoline's favour.
- E5 vs ULSD spread (Eurobob vs NWE CIF ULSD) narrowed from -$115.10/mt (April avg) to -$63.57/mt (May avg), closing at -$80.75/mt; gasoline closed half the gap to distillate in one month.
- E5 vs Naphtha widened from $153.39/mt (April avg) to $243.49/mt (May avg), close $229.50/mt; naphtha as petchem feedstock lagged motor-fuel demand pull as driving season approached.
- MTBE NWE FOB Barges averaged $1,138.21/mt vs E5 $1,099.85/mt — MTBE traded above gasoline outright through the month, oxygenate economics constructive into summer blending.
- 98 RON NWE FOB Barges led grades at $1,142.91/mt vs E5 $1,099.85/mt; premium-regular spread held through the volatility, consistent with intact summer-grade demand.
Cross-Regional Dynamics
- E5 vs Swaps physical premium widened: opened at +$43/mt (1-May), the highest mark of the year so far, before collapsing to +$7/mt at month-end (27-May) as the prompt selloff pulled barges down toward paper; May avg +$21.28/mt vs April avg +$18.09/mt.
- Singapore 92 RON vs Eurobob arb stayed closed: Singapore 92 close 27-May $116.61/bbl vs E5 close-equivalent $117.02/bbl (-$0.41/bbl), broadly in line with April's closed-arb position; eastbound flow not incentivised through May.
- RBOB vs E5 spread widened to $0.394/gal (May avg) vs $0.366/gal (April), close $0.365/gal; US driving-season premium held even as headline flat price retraced, with US summer-grade RVP rules and post-Memorial Day pull keeping the transatlantic spread bid.
- Med 95 vs E5 stable at +$10.51/mt (May avg) vs +$10.95/mt (April); no regional dislocation within Europe — the shock priced uniformly across NWE and Med.
Curve Structure
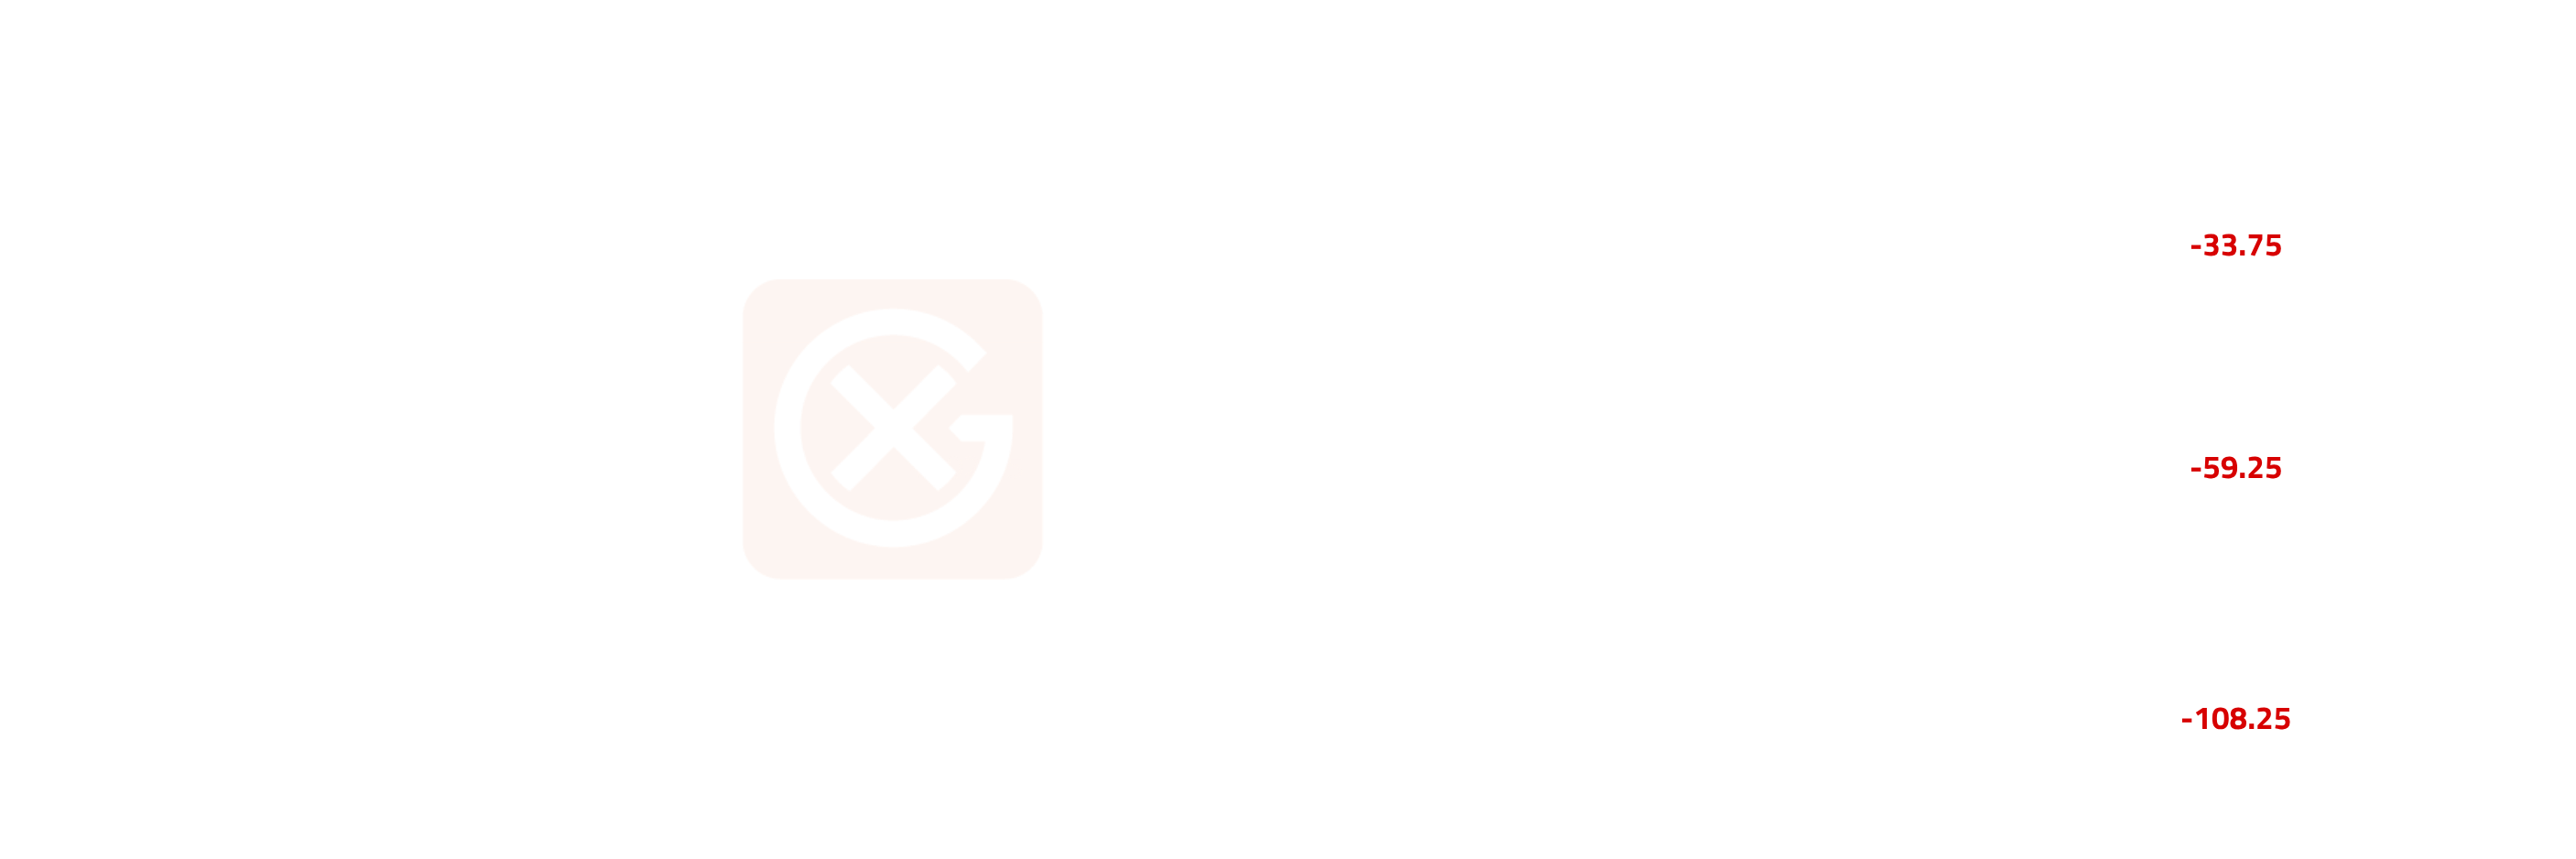
- Curve flipped from bull steepening (April) to front collapse on the late-May selloff: M1-M6 narrowed $108.25/mt as the prompt led the move down while the back held.
- M1-M2 narrowed 67% (50.50 → 16.75/mt, -33.75); M1-M3 narrowed 58% (102.75 → 43.50); M1-M6 narrowed 39% (278.25 → 170.00).
- Magnitude of narrowing scales with tenor distance — M1-M6 collapsed by 3.2x more than M1-M2 in absolute terms — consistent with the prompt unwinding the disruption premium while the deferred holds the structural Hormuz risk.
- Front collapse is the curve framework's textbook response to "prompt demand evaporates or prompt supply surges"; here the mechanism is the MOU-driven discount rate applied to reopening expectations, dragging the front toward the back rather than the back rallying to meet the front.
- Back-end resilience matters: M6 still backwardated $170/mt to M1 at month-end signals the curve has not priced sustained reopening — only a partial unwind of the prompt risk premium; carry trade does not yet activate.
Price Volatility
- E5 May CV at 4.83% (17 days) eased slightly from April's 5.23% but remains 60% above the pre-conflict 3.02-3.07% baseline (Jan-Feb 2026); volatility regime has not normalised despite two months of distance from the war's start.
- Crack-spread volatility tells the more telling story: CV collapsed from April's 471% (mean near zero amplified the ratio) to May's 11.4% — a more normal level given the crack itself stabilised in positive territory at $25/bbl average. The April CV is mathematically extreme rather than market-extreme; May's 11.4% is the meaningful read.
- Hedging models calibrated to 3-4% CV pre-conflict still under-price tail risk by ~50%; assume mid-single-digit CV as baseline while Hormuz remains the binary catalyst.
Something to Watch
- Gasoline crack vs ULSD crack — the refinery yield switch:
- Observation: E5-Brent crack at $25.39/bbl (May avg) vs ULSD-Brent crack at $49.17/bbl; gasoline closed half the historic gap in one month.
- Why it matters: a sustained gasoline-distillate crack ratio above the May level incentivises European refiners to maximise gasoline yield over middle distillates ahead of summer; the gasoline crack widening into June would tighten distillate supply further while easing gasoline. Yield response typically takes 4-6 weeks to show in flows.
- What to monitor: weekly E5-Brent and ULSD-Brent crack ratio; European refinery yield reports (Insights Global, IEA); ARA gasoline and diesel inventory splits.
- IEA "red zone" (July-August) inventory math:
- Observation: IEA May OMR cumulative inventory draws of ~416 mb since 28-Feb (~10 days of pre-war global demand); 14 mb/d of Middle East crude still off the market; 2Q26 demand forecast cut 2.45 mb/d on price-led demand destruction.
- Why it matters: peak driving demand layered on a depleted inventory cushion is the IEA's framing of asymmetric upside risk; if Hormuz reopening slips past June, July-August prints could exceed May highs as the storage buffer that absorbed shocks earlier in the war is gone. The IEA flags gasoline-specific demand contraction at -1.2% in 2026 but notes pass-through to retail is already advanced — meaning further price upside meets less elastic demand.
- What to monitor: weekly IEA inventory commentary; daily Hormuz transit count (Kpler, Vortexa); US gasoline driving-season demand prints (EIA weekly).
- Front collapse durability — MOU implementation vs breakdown:
- Observation: M1-M2 closed +$16.75/mt (27-May), the narrowest of the cycle; physical E5 vs Swaps premium collapsed from +$43/mt (1-May) to +$7/mt (27-May).
- Why it matters: MOU implementation triggers further M1-M2 compression (potentially into contango if Hormuz reopens) and unwinds the physical premium toward zero; MOU breakdown re-widens M1-M2 toward the April end-month $37.75/mt level and re-bids the physical premium back to $25-40/mt range. The asymmetry: reopening is gradual, breakdown is overnight.
- What to monitor: Trump's MOU approval decision; daily Hormuz transit count; weekly E5 vs Swaps premium close.
Note: All figures, prices and market activity referenced in this report are based on the period 1-29 May.