.webp)
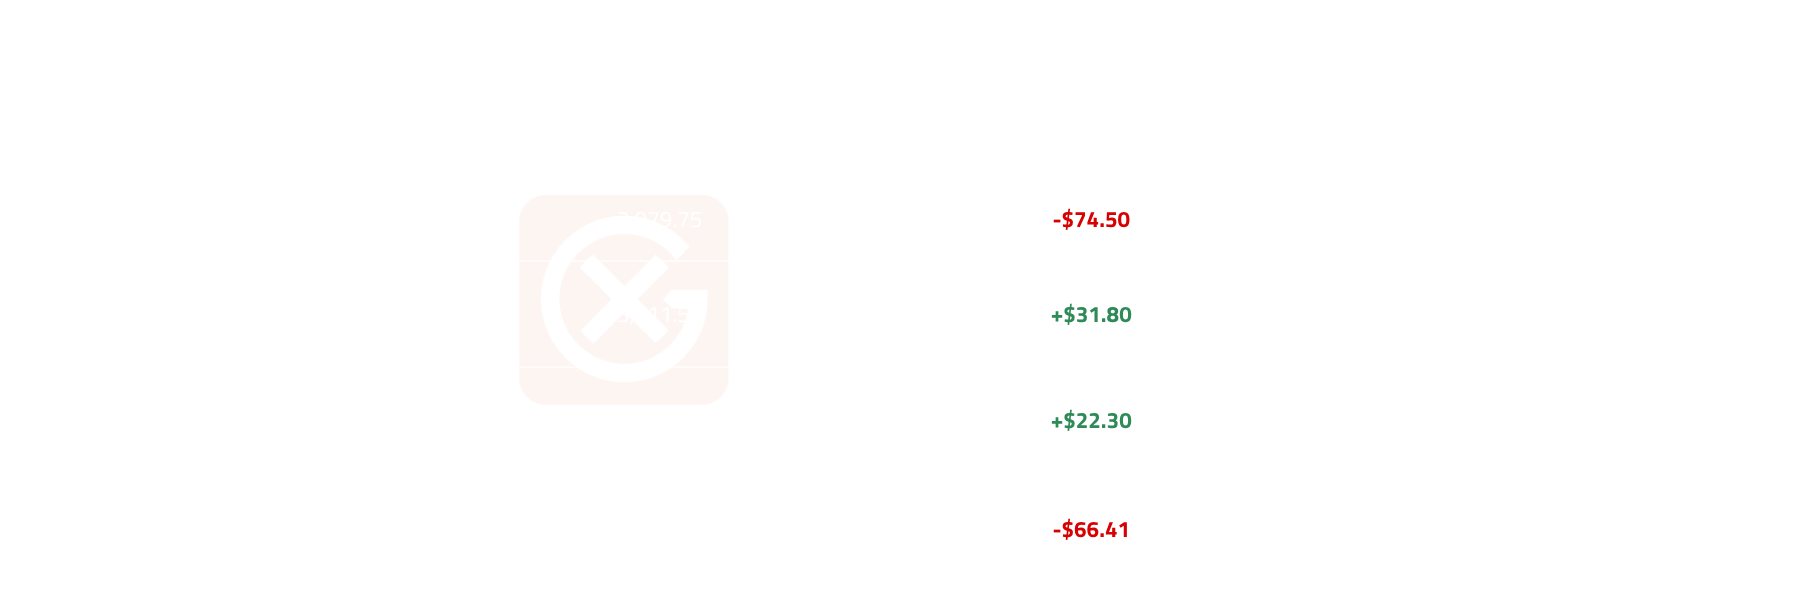
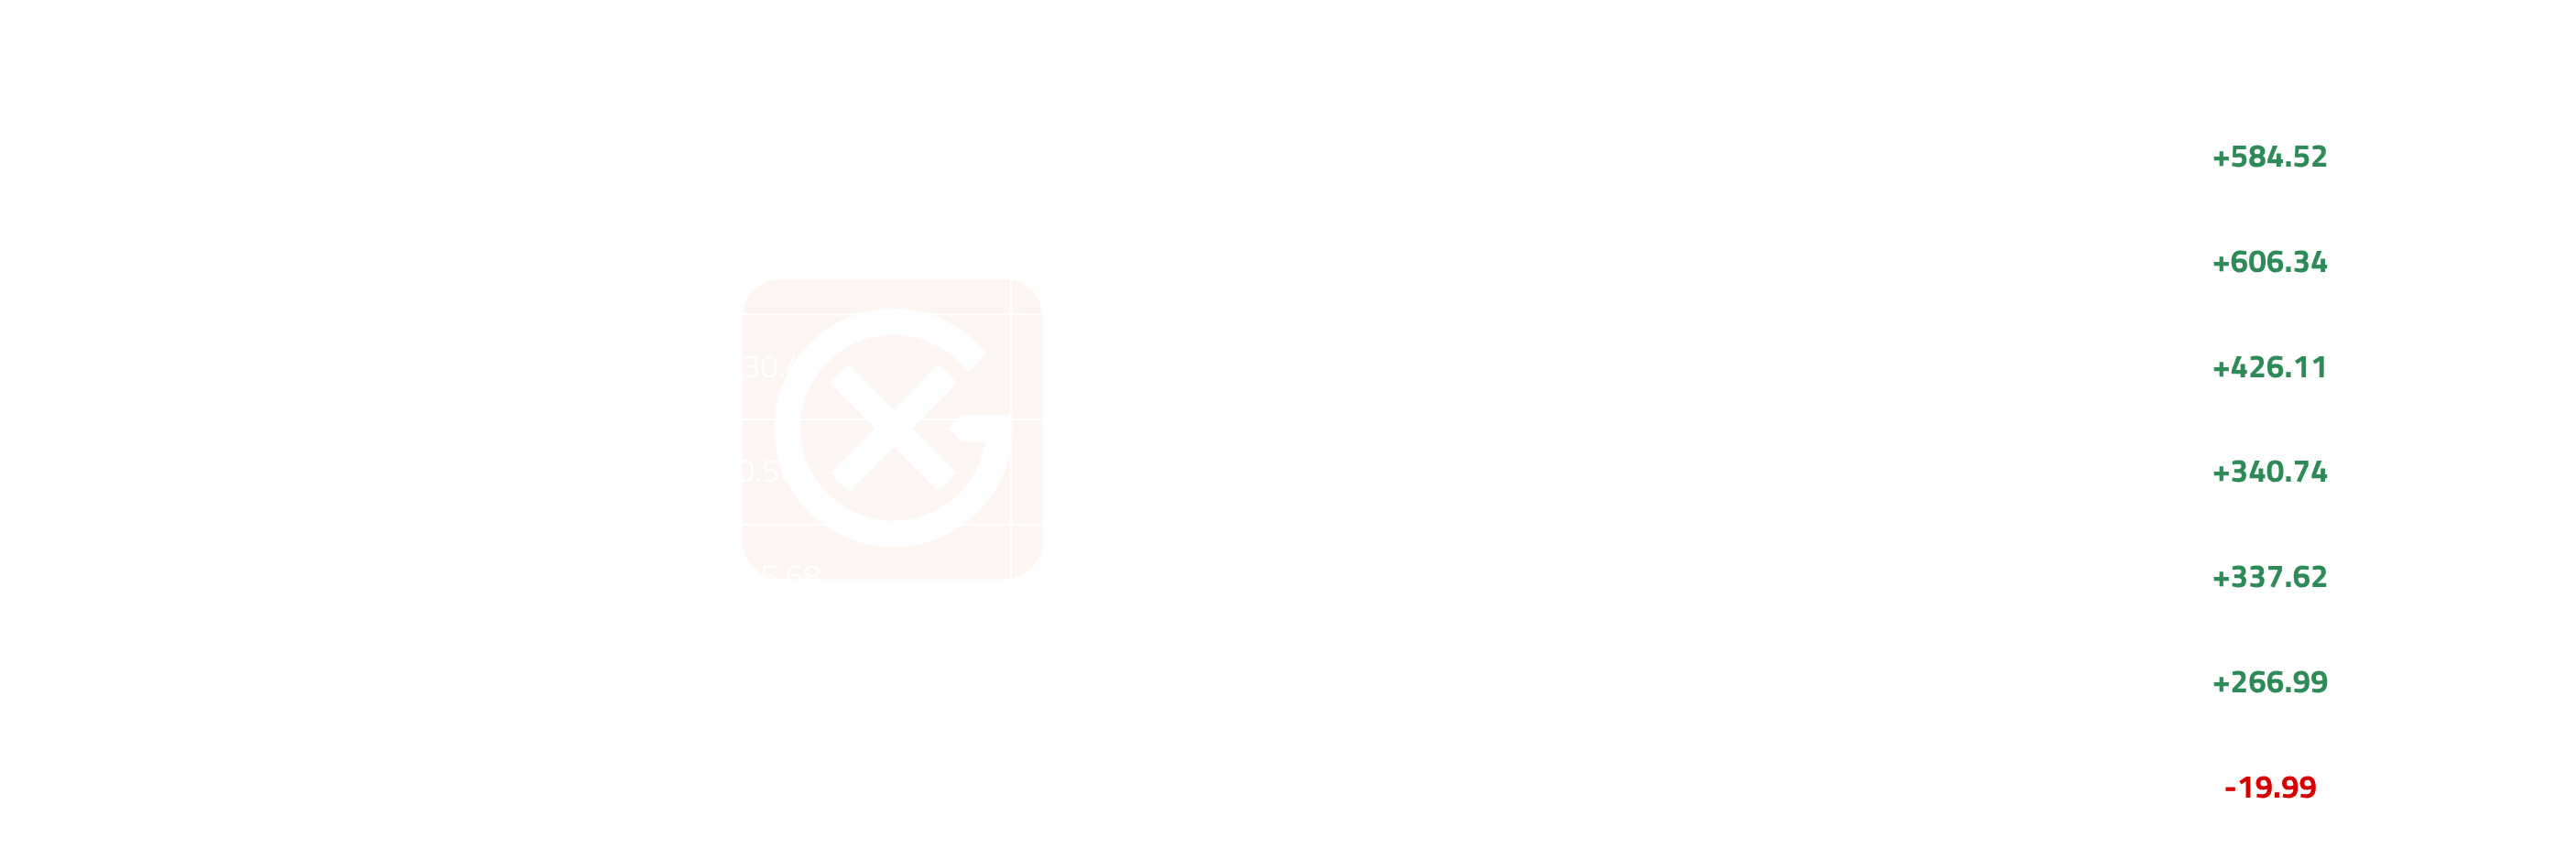
European SAF Neat HEFA prompt averaged $3,003.68/MT in May vs $2,663.16 in April (+12.79% MoM) on a sustained re-rating of the green premium against a softening jet leg. Conventional Jet NWE CIF vs Brent crack compressed -$19.99/bbl ($75.60 → $55.60) as the Middle East / Hormuz supply stress that drove April's record jet levels unwound, yet SAF flat price rose 13%, the green premium did the work, widening +$584.52/MT MoM to $1,747.92 on a prompt basis, the largest monthly absolute widening in the GX series. The same-feedstock relationship with HVO Class II inverted decisively: SAF vs HVO Class II prompt swung from -$269.75/MT in April to +$70.99/MT in May (+$340.74 swing), reaching +$143.50 by W5, the textbook signal for HEFA refiners to reallocate capacity back to SAF. The full flip will be partial because EU anti-dumping measures limit how much European refiners can backfill their renewable diesel obligations with Asian imports, and that ceiling shows in the curve: May ended with M1-M12 backwardation compressed to $197.50/MT (from $370.00 at month-start, $493.75 at April-end), the front giving back while the back held, bear flattening, the inverse of April's bull steepening, with M1-M12 closing the month just below the $200/MT structural-easing threshold. MOC activity confirmed both sides re-engaged: 34 transactions (vs April's 13), 5 cleared trades (vs 1), Shell back as dominant offer-maker with 15 of 16 offers, Petroineos continuing as dominant compliance buyer posting 10 of 13 bids and lifting all 5 trades. Production margin recovered +$337.62 to $1,433.80/MT, leaving European HEFA producers cash-fat against the rebuilt premium.
Market Activity
- Activity normalized: 34 transactions in May vs 13 in April (+162% MoM) and vs 58 in March; bid/offer ratio 13:16 (0.81) returned to the March-style offer-heavy stack from April's inverted 9:3 (3:1 buy-skew).
- Bid-offer spread renormalized to -$69/m³ (offers above bids) from April's +$104/m³ inversion; the offered-out signature that defined April is fully resolved.
- Shell single-handedly restored offer-side supply: 15 of 16 May offers vs only 2 in April, walking the offer up from $1,290/m³ (May 8) to $1,440/m³ (May 28), a +$150/m³ escalation through the month; BP added the only non-Shell offer on May 27. Producer participation back to March intensity (March: Shell 10 offers + 5 sells = 15 sell-side actions).
- Read as flow rather than positioning, Shell offering daily across 12 of the 16 May trading days with progressive premium increases reflects a producer with physical SAF length to clear, consistent with HEFA refiners ramping SAF runs as the SAF/HVO spread inverted.
- Petroineos continued as the dominant compliance buyer: 83% concentration of buy-side actions with bid premiums walking from $1,280/m³ (May 8) to $1,380/m³ (May 26), programmatic, price-inelastic offtake against rising offers, consistent with mandate coverage rather than discretionary positioning. All 5 trades cleared at $1,280-$1,295/m³ ($2,928-$3,026/MT outright).
- Mitsui & Co. Energy Trading Singapore appeared on both sides, the cleanest Asian intermediary footprint in NWE SAF MOC since early 2026; no Unipec or other Asian names this month.
Price Action
- SAF Neat HEFA NWE FOB Barges (prompt) averaged $3,003.68/MT in May vs $2,663.16 in April (+$340.52, +12.79% MoM); intra-month low $2,967.44 (W5 avg), high $3,054.25 (W1 avg), range of just $87/MT or 2.9% of the monthly average, a strikingly tight band against the April range of $607/MT.
- The story is not the flat price but the green premium: SAF flat price was effectively flat through May, the SAF vs Jet FOB green premium widened +$155.75/MT in W2 alone and ended the month at $1,747.92 avg (vs $1,163.40 in April).
- Conventional Jet NWE CIF flat price fell ~$170/MT MoM (Jet crack vs Brent -$19.99/bbl); SAF flat price rose +$340.52/MT MoM, the +$584.52/MT green premium widening is consistent with both sides of that arithmetic.
- Two-phase pattern within the month: W1-W4 stable around the new $3,000/MT plateau (the W5 April snap-back level held cleanly); W5 the SAF/HVO spread completed its inversion (reaching +$143.50) while flat price drifted -$66/MT on the week, signalling the demand pulse is concentrated in the green premium, not the underlying barrel.
- Single biggest WoW move on Prompt basis was W2's -$74.50/MT (May 4-8 vs W1's May 1), a brief consolidation pullback that the market bought through W3-W4; the 5 May trades all cleared in W2-W3 (May 7-13) at $1,280-$1,295/m³ premiums to LSGO 7-28d.
Cross-Market Dynamics
- Same-feedstock relationship FLIPPED: SAF Neat HEFA prompt +12.79% MoM while HVO Class II prompt essentially flat at -0.01% ($2,932.91 → $2,932.70), a 12.8 percentage-point spread in monthly performance from co-products produced in the same refineries from the same feedstock.
- SAF vs HVO Class II prompt averaged +$70.99/MT in May vs -$269.75/MT in April (+$340.74 MoM swing); spread walked from +$99 in W1 down to +$11 in W2, back to +$17 in W3, then jumped to +$109 in W4 and +$143.50 in W5, the W4-W5 widening is the textbook refiner-allocation signal.
- Mechanism: HEFA refineries co-produce SAF and renewable diesel and maximise the higher-margin grade; with SAF now trading $100+/MT OVER HVO Class II rather than $300/MT under, the economic pull is to reallocate capacity back to SAF. The flip is partial rather than full because EU anti-dumping measures on Asian renewable diesel limit European refiners' ability to backfill their HVO obligations with imports, so a complete swing to SAF runs is structurally constrained.
- HVO Class I prompt +5.53% MoM ($2,681 → $2,829) and UCOME +6.66%, both bio-distillate products firmed, but proportionally less than SAF. The whole bio-jet/diesel complex re-rated higher; SAF re-rated hardest. HVO Class I vs ULSD CIF widened +$266.99/MT MoM ($1,378.56 → $1,645.55), confirming the renewable diesel complex re-rated alongside SAF.
- Green premium (SAF vs Jet FOB) widened from $1,163.40 (April) to $1,747.92 (May), +$584.52/MT MoM, with intra-month low $1,607.75 (W1) and high $1,847.75 (late W5), a $240/MT intra-month range; the May average premium exceeds even the W5 April peak of $1,578, confirming this is a sustained re-rating not a spike.
- SAF vs LSGO M1 widened from $1,413.11 to $1,839.22 (+$426.11), intra-month range $172/MT (75% narrower than April's $687); the move is structural, the volatility around it is calming.
- Jet crack vs Brent compressed -$19.99/bbl ($75.60 → $55.60, -26.5%), conventional jet weakened as Hormuz / Middle East supply stress unwound and inventories rebuilt; the flat-price tailwind for the bio leg that April lacked is now an active headwind, yet SAF rallied through it.
- Production margin (SAF Prompt vs SAF Netherlands Production Cost) recovered from $1,096.19 to $1,433.80/MT (+$337.62, +30.8% MoM); intra-month range $306.50/MT (low $1,245.75, high $1,552.25). European HEFA producers are now cash-fat against a stable feedstock cost line.
Cross-Regional Dynamics
- China-origin landed UCO CIF NWE premium over local UCO CIF NWE held at +$63.89/MT in May (vs +$77.57 in April, +$106.16 in March), the structural narrowing continues but the rate has slowed; against local UCO FOB, China-origin landed CIF discount widened slightly from -$17.70 to -$52.68/MT MoM as local UCO FOB outpaced China-origin.
- Local UCO firmed faster than China-origin: NWE UCO FOB +$38.18/MT (+3.04%), NWE UCO CIF +$18.61/MT (+1.61%), China-origin landed CIF only +$7/MT (+0.57%), the local feedstock pool is bid up as European refiners ramp SAF runs after the allocation flip, while Asian supply is incremental rather than directional.
- Jet CIF vs Jet FOB barges spread compressed from $53.19 to $31.37/MT MoM (-$21.82), intra-month range $79, the import-side jet stress that gated April SAF blending demand is largely resolved; Hormuz-related jet supply disruption easing through May.
- Asian counterparty footprint in NWE SAF MOC: Mitsui & Co. Energy Trading Singapore appeared on both sides, the cleanest Asian intermediary participation since early 2026; consistent with the broader picture of Asian-origin SAF and feedstock supply being available as an incremental rather than dominant flow.
- Implication: the structural cost-loosening from China-origin UCO availability is real but slowing; the active May driver was demand pulling European SAF runs higher, not feedstock weakness pushing them lower. Combined with EU anti-dumping limits on Asian HVO imports, this entrenches a partial-rather-than-full SAF/HVO reallocation.
Curve Structure
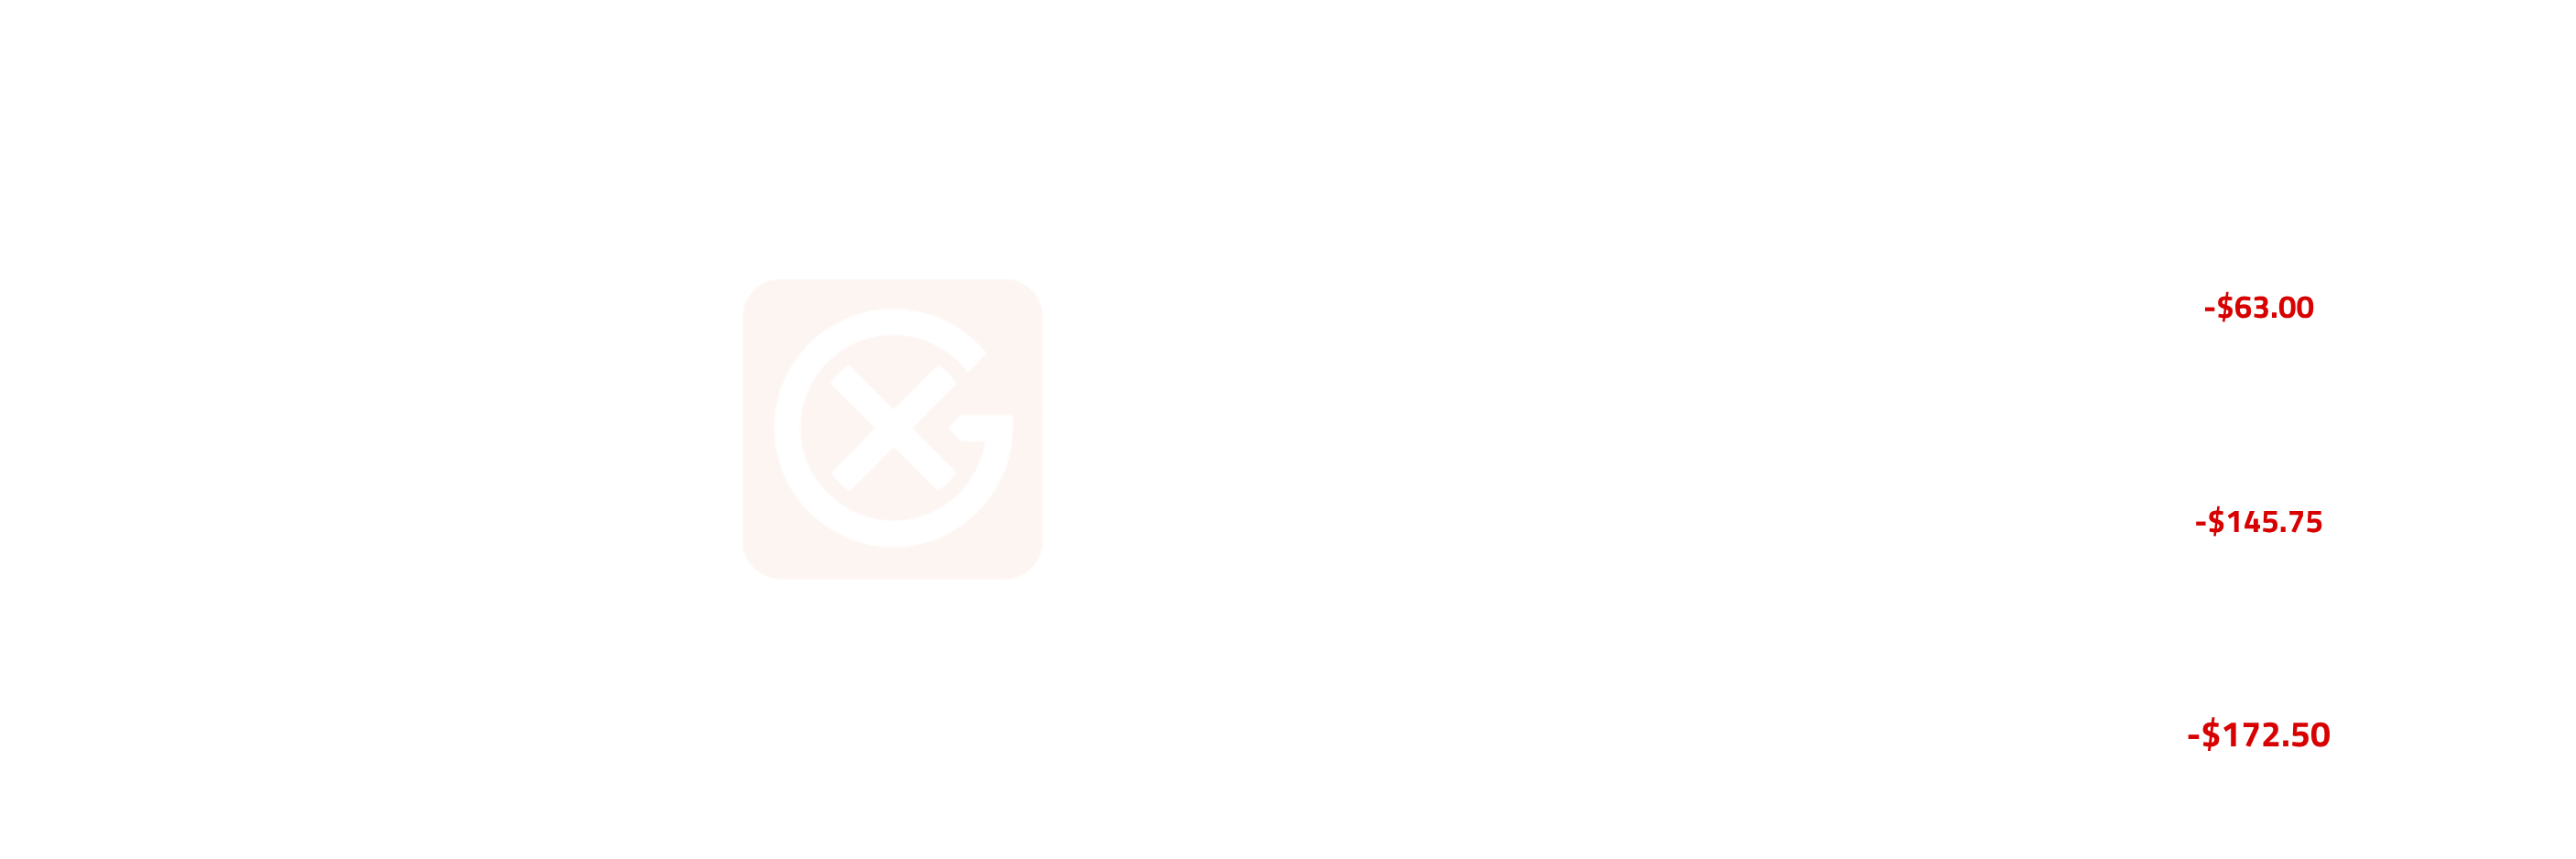
- Bear flattening, the inverse of April's bull steepening: M1 settlement fell $163.50/MT through May ($2,894 → $2,730.50) while M12 rose only $9 ($2,524 → $2,533); the front gave back, the back held flat.
- M1-M12 backwardation collapsed from $370.00/MT (May 1) to $197.50 (May 29), -$172.50 MoM in spread terms, closing the month just below the $200/MT threshold flagged as the structural-easing trigger; M1-M6 collapsed from $229.00 to $83.25 (-$145.75); M1-M2 collapsed from $77.50 to $14.50 (-$63.00).
- The flattening was concentrated at the front: M2 fell $100.50 vs M1's $163.50 (M1-M2 compression), M6 fell only $17.75 ($2,665 → $2,647.25) and M12 firmed $9, the back end is pricing structural normalization of refiner allocation while the front gives back its April scarcity premium.
- Pattern call: bear flattening, when prompt eases sharper than deferred, the market is signaling immediate scarcity is resolving while structural conditions remain firm. Reading this with the SAF/HVO spread inversion and Shell's offer-side return: the prompt scarcity that justified the April $493/MT M1-M12 spread has cleared, but the deferred curve still prices SAF as structurally tight versus its long-term cost base.
- Implication: long M1 vs short M12 (the April winning trade) is now the losing trade; the curve has already priced in much of the supply-side restoration. The May 29 close at $197.50/MT crossed below the $200/MT structural-easing threshold for the first time, signalling the market is starting to price meaningful normalisation; sustained compression below $150/MT would confirm full reallocation. Anti-dumping ceilings on Asian HVO imports cap the maximum allocation flip and therefore the maximum prompt easing.
Price Volatility
- May CV of 2.10% (M1 settlement basis) was about half of April's 4.07% and approaching the November-February calm regime (1.25-1.48%); the market has settled at the new green-premium plateau and intra-month price dispersion has collapsed.
- Stressed-regime months (Dec-25 6.68%, Mar-26 6.57%, Apr-26 4.07%) have given way to a calmer May reading; the volatility was concentrated in the spread re-rating, not in the flat price (which traded a tight $87/MT range all month).
- Range-based view confirms it: SAF Prompt range $87/MT in May vs $607 in April (86% reduction); SAF green premium range $240/MT in May vs $675 in April (64% reduction); the violent intra-month dispersion that defined March-April is over.
- The structural reading: SAF is now in a higher-price, lower-volatility regime. Flat price stable around $3,000/MT, green premium stable around $1,750/MT, both compatible with a market where supply allocation has shifted (Shell offering daily, refiner allocation flipped) and compliance demand has been confirmed (Petroineos every trading day).
- Implication: hedging models can return to calm-regime assumptions for SAF flat price; but spread volatility models calibrated to pre-March 2026 are still under-sized given the persistent 20-25% widening monthly swings in cross-product spreads (SAF/HVO, green premium, production margin).
Something To Watch
- SAF/HVO Class II spread as the refiner-allocation confirmation signal:
- Observation: averaged +$70.99/MT in May (vs -$269.75 in April) with the W5 reading at +$143.50/MT, the highest in the visible series.
- Why it matters: as long as the spread holds above +$100/MT, HEFA refiners are economically pulled toward SAF rather than HVO; EU anti-dumping ceilings on Asian HVO imports cap the maximum reallocation, so even a wider spread won't translate to a full SAF supply surge. A reversion below +$50/MT would signal the May reallocation was a one-month adjustment rather than a sustained shift.
- What to monitor: weekly SAF Neat HEFA vs HVO Class II spread (GX0017975); the +$100/MT threshold separates partial-flip from full-flip dynamics. Cross-check with Shell's MOC offer count, sustained 15+ offers per month confirms the producer-side response is real.
- Petroineos bid behaviour as the compliance-demand ceiling test
- Observation: Petroineos posted May bids and lifted all trades, walking bid premiums from $1,280 to $1,380/m³ through the month; the same dominant buy-side concentration as March and April, only now with execution.
- Why it matters: Petroineos is the single most reliable compliance-coverage signal in the NWE SAF window. A drop in bid frequency, or bid premiums plateauing below $1,300/m³, would suggest Q2 coverage is complete and demand pressure easing into Q3. Continued daily presence at progressively higher premiums signals 2026 mandate compliance has further to run.
- What to monitor: weekly count of Petroineos bids and average bid premium; emergence of additional buy-side names (broadening of compliance coverage). A new compliance buyer entering at $1,300+/m³ would confirm structural demand.
- M1-M12 backwardation breaking the $200/MT floor as the structural-easing barometer:
- Observation: M1-M12 collapsed from $370.00 to $197.50/MT through May (-$172.50), closing the month just below the $200/MT threshold on May 29, the first sub-$200 reading since the March crisis.
- Why it matters: bear flattening with M1-M12 breaking below $200/MT signals the market is now actively pricing supply normalisation, not just easing of acute scarcity. If M1-M12 sustains below $150/MT in June, the structural re-rating is unwinding and the entire SAF green premium may follow lower. If it stabilises around $200-250/MT, the new equilibrium holds and the May pattern persists.
- What to monitor: weekly M1-M12 spread vs the $150/MT floor (full normalisation trigger) and the $250/MT ceiling (pattern-failure trigger); M12 settlement direction (currently $2,533/MT, flat for the month) as the cleanest medium-term signal.
Note: All figures, prices and market activity referenced in this report are based on the period 1-29 May.