
U.S. natural gas prices surged sharply over the week (19th-23rd January), with Henry Hub skyrocketing ~170%, jumping from $3.04/MMBtu to $8.21/MMBtu, reflecting extreme volatility and tightening near-term fundamentals.
- Cold spike, thin liquidity: Prices rose across key hubs while volumes fell 66–85%, pointing to stress-driven moves rather than broad participation.
- Weather risk largely priced in: Price gains occurred alongside sharply lower volumes, suggesting the market had anticipated the cold impact.
- Volatility persists near term: Freeze-offs and futures short-covering likely keep prices volatile into early February.
- Regional constraints drove extremes: Ventura, Algonquin, and Iroquois Zone 2 saw the largest moves, far above winter averages, while Henry Hub rose more modestly.
- Northern Ventura (SoCal) – Severe weather and delivery constraints produced outsized, multi-day price surges.
- Algonquin Citygate – Significant Northeast dislocation as cold amplified pipeline constraints.
- Henry Hub – Benchmark prices rose materially but less dramatically, reflecting national pricing rather than localized scarcity.
- National averages mask divergence: January prices fell YoY at Henry and Algonquin but surged at Ventura, reinforcing localized tightness over systemic shortage.
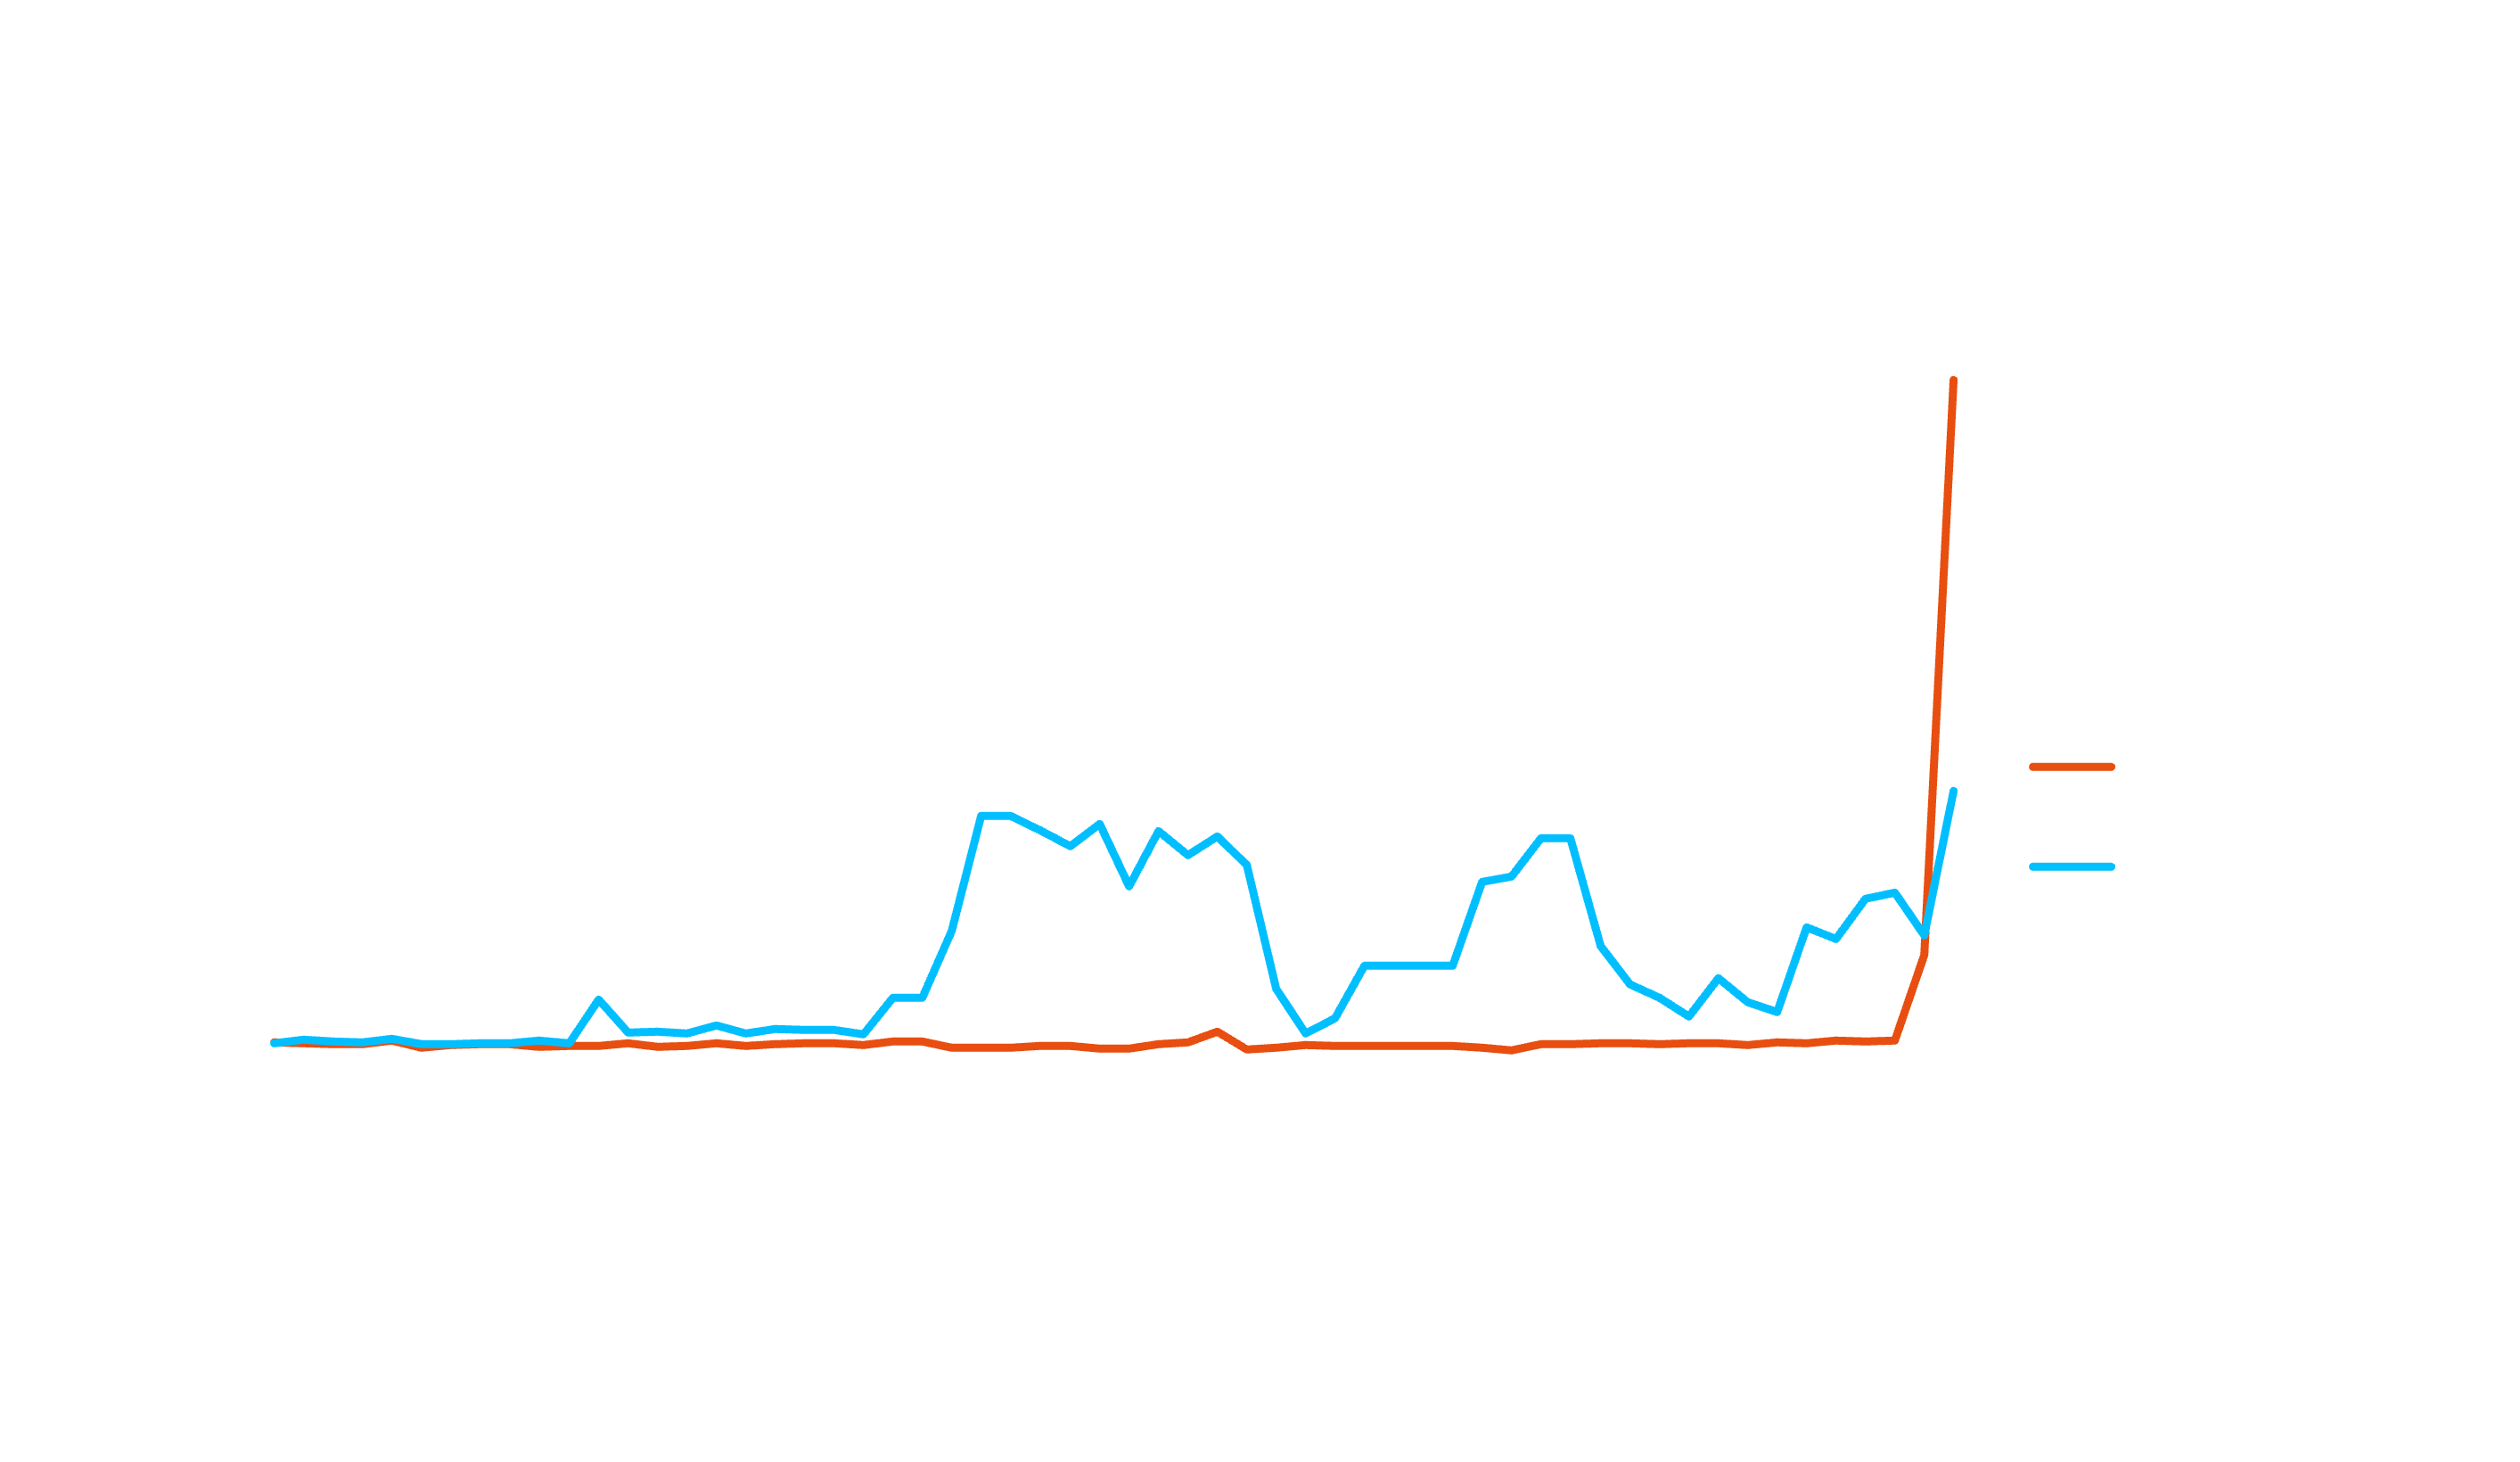
Price vs Trading Activity
Comparison: 30-day baseline vs last 5 trading days:
Actual Trade Numbers
Daily averages over each window:
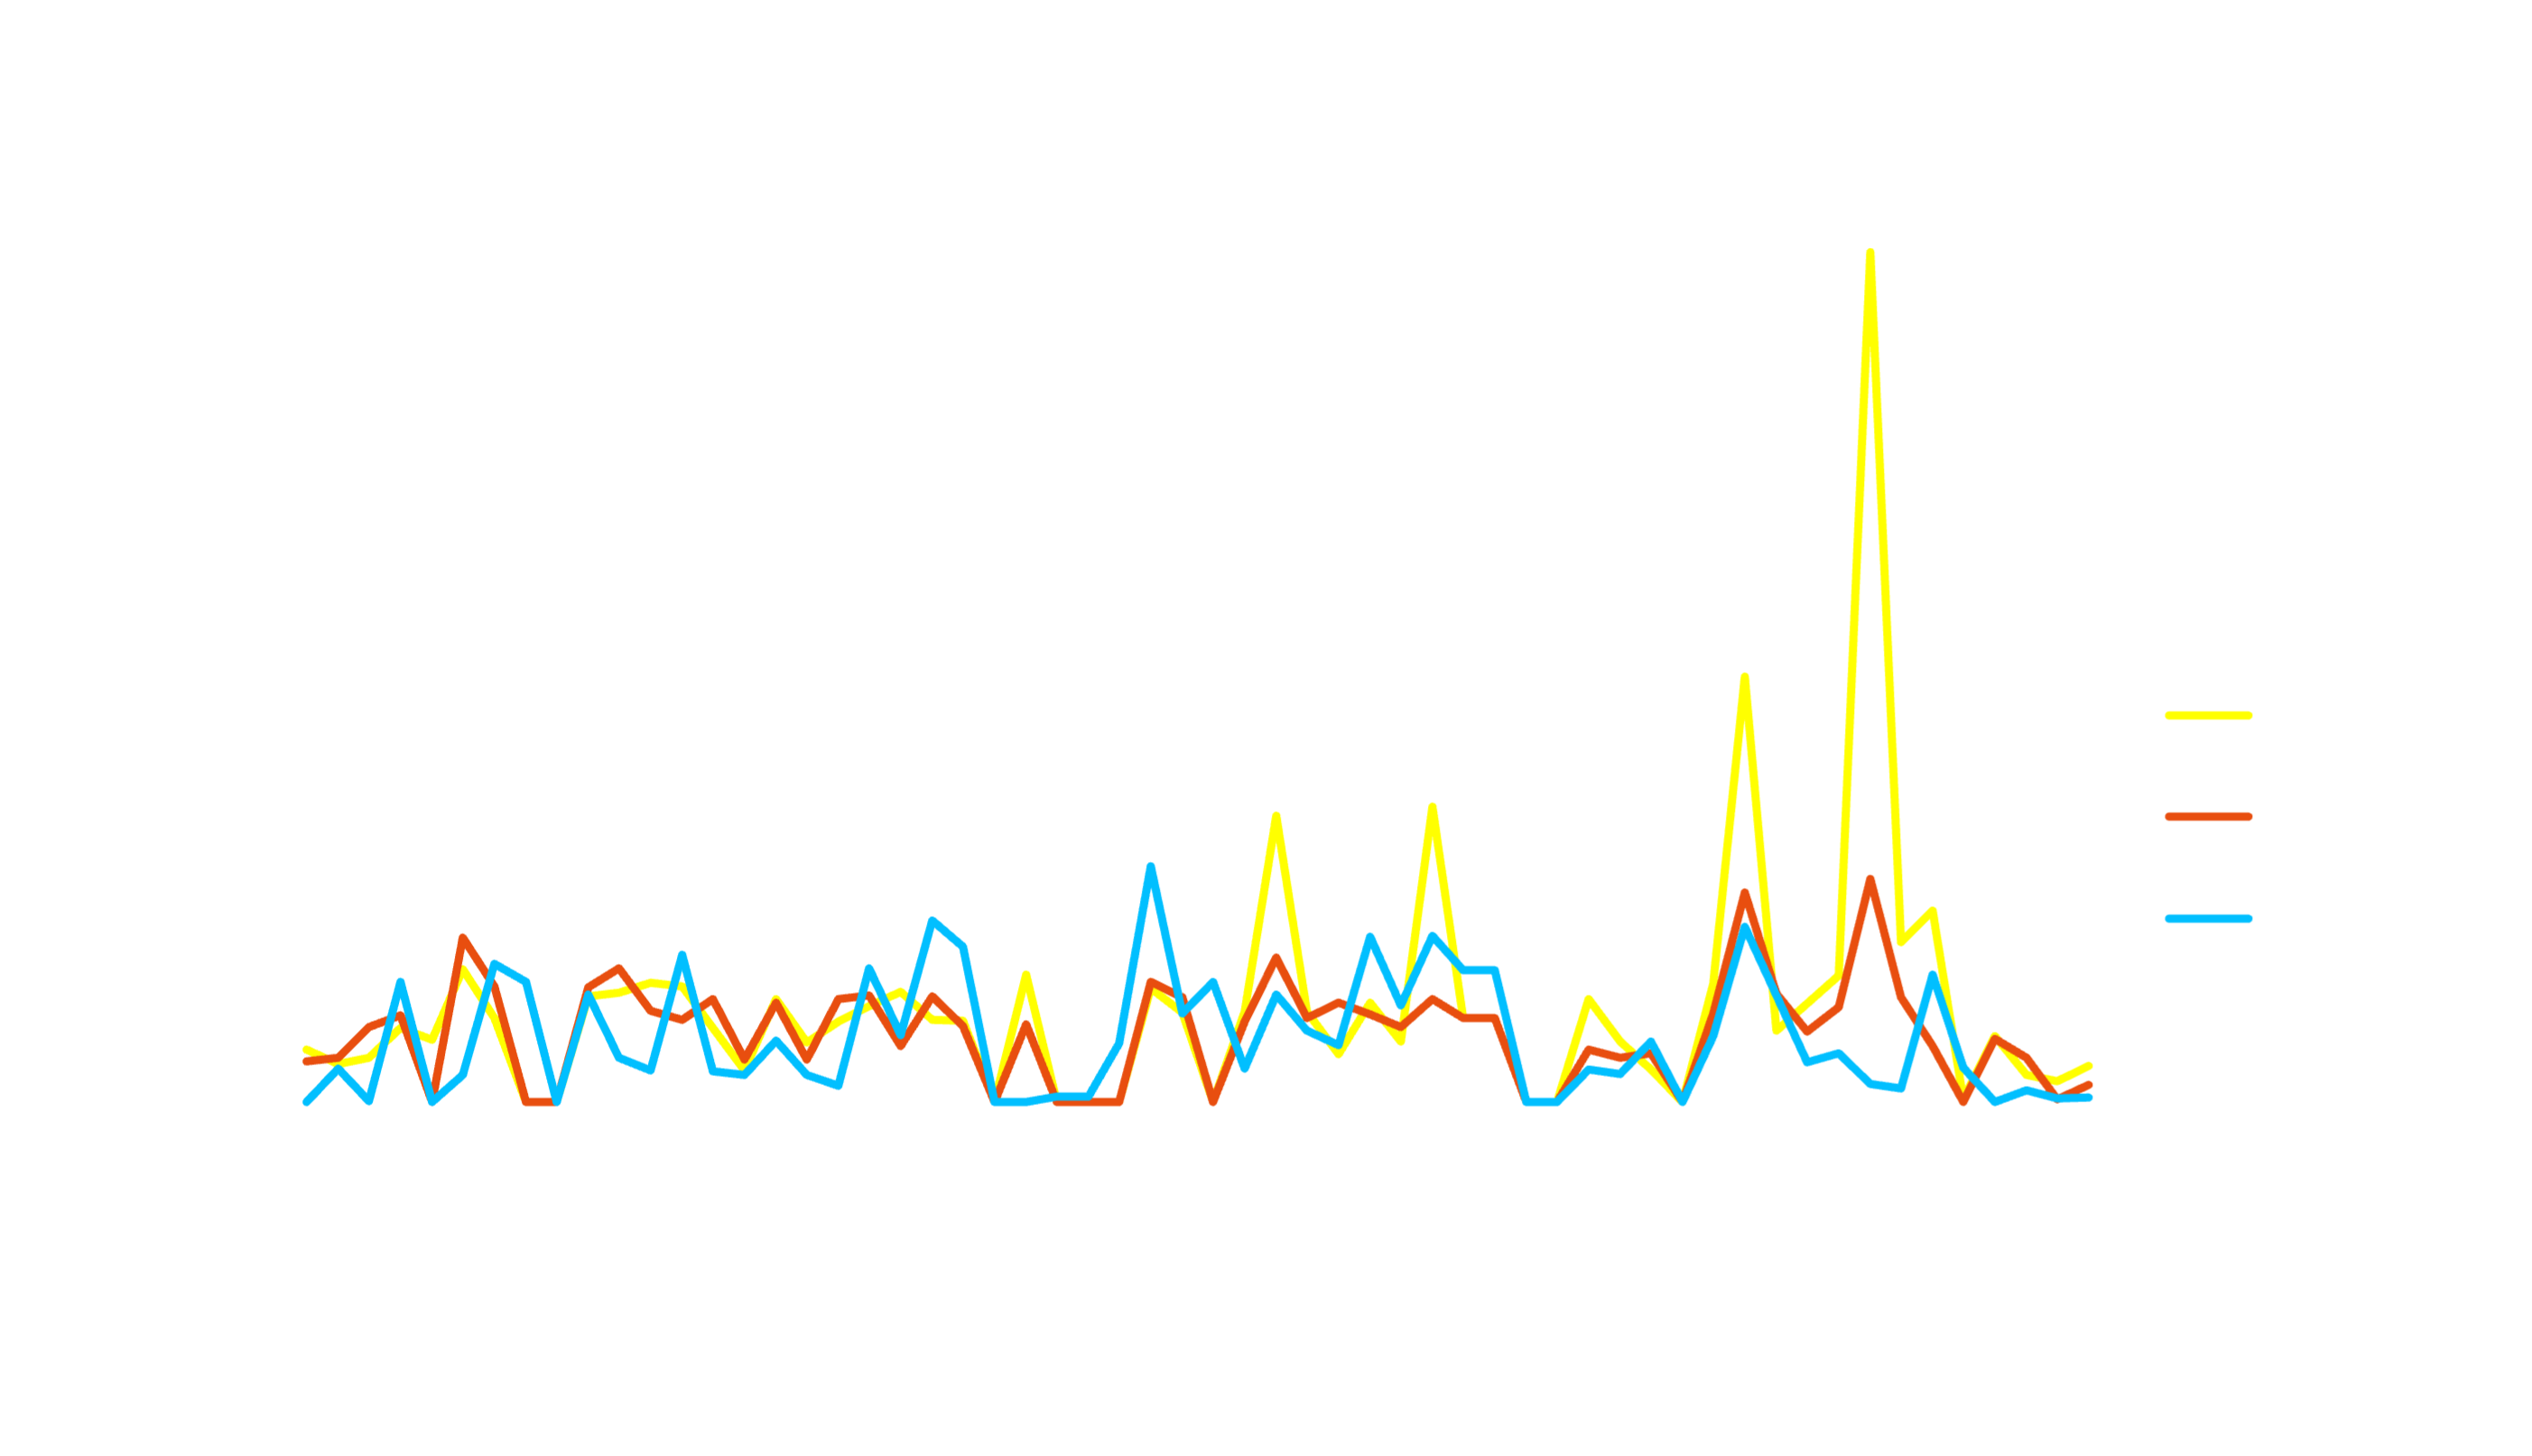
Henry Hub pricing appears overextended and likely remains disconnected from underlying fundamentals.
- Henry Hub (HH) physical next day +157% to $8.215 vs YTD average $3.185.
- Next day trading pattern mirrors early January 2025 weather event (week 3 average $5.52), and weekly average of next day exceeds 5-year seasonal max of $4.35.
- HH February bidmonth at $5.05, +$1.54 vs prior contract average.
Cold weather having outsized effect on hubs that traditionally face weather-driven delivery constraints.
- Northern Ventura jumped from $3.759 Tuesday to $9.592 Wednesday to $41.76 today. Winter 2024/2025 average was $2.834.
- Algonquin at $26.85, nearly 4x winter 2024/2025 average of $7.11. Volatility is expected through March, regardless of relief from the current arctic blast.
Year-over-Year Comparison (January)
How does January 2026 compare to January 2025?
- Henry: Prices down 15% vs last January
- Ventura: Prices up 87% vs last January - regional tightness
- Algonquin: Prices down 33% vs last January despite recent spike
Markets that Diverged from Expectations
- Transco Zone 6 NY – Counter trend Outlier: Prices declined during one of the coldest weeks of the winter, moving against the broader market. Transco Z6 fell $1.49/MMBtu from Jan 14–21 while Houston Ship Channel rose $2.08/MMBtu over the same period.
- Waha Hub (Permian Basin) – Persistent Negative Pricing: Despite a 70%+ national rally, Waha remained deeply negative. The Feb ’26 prompt traded between −$2.94 and −$3.15, with negative daily pricing throughout January.
- Chicago Citygate – Weather Underperformance: Even at the center of the vortex, Chicago lagged. Prices fell to $2.695/MMBtu on Jan 15 and have averaged a $1.11/MMBtu discount to year-ago levels since Jan 6.
- Iroquois Zone 2 – Largest Move in North America: Prices surged $18.215 to $31.160 on Jan 22, marking the most extreme regional dislocation.
- Houston Ship Channel – Top Regional Gainer: Prices rose 71%during Jan 14–21, leading all markets and marking the largest weekly gain since 1990.
.png)

.webp)