The European crude market surged in reaction to events in the Mideast Gulf, with gains seen on outright prices, physical cargo differentials and prompt tenors of Brent derivative markets, in reaction to physical shortfalls in Mideast Gulf exports.
Dated Brent averaged $101.56/bl in March (1-27 Mar), up $30.45/bl (+42.8%) MoM vs February's $71.11/bl. The market opened at $77.71/bl (2-Mar) and closed the period at $120.31/bl (27-Mar), with a single-day drop of $14.60/bl on 10-Mar – the month's most significant intraday move.
The weekly CFD strip and physical differentials moved in lockstep with the flat price rally: W1 CFD surged +$15.88/bl over the month, while backwardation in the Cash BFOE (forward) market reached +$13.52/bl by 27-Mar (premium of first month to third month contracts), compared to +$2.85/bl at the start of the month. Dated Brent's premium to M2 Cash BFOE reached +$15.79/bl at month-end, up by $14.53/bl over the period.
Cash BFOE Partials trade activity:

Key shifts in March:
- Gunvor - dominant seller in February (112 deals, 50% of all trades) - did not sell any Cash partials in March.
- Mercuria reversed roles: top buyer in Feb → top seller in March .
- Petroineos rose to the #1 buyer spot in March (55 deals vs 31 in Feb).
- Vitol emerged as a major seller in March (28 deals) having sold nothing in February.
Weekly Brent CFDs activity:
Volume fell sharply MoM; W1 surged +$15.88/bl as entire strip moved into steep backwardation.
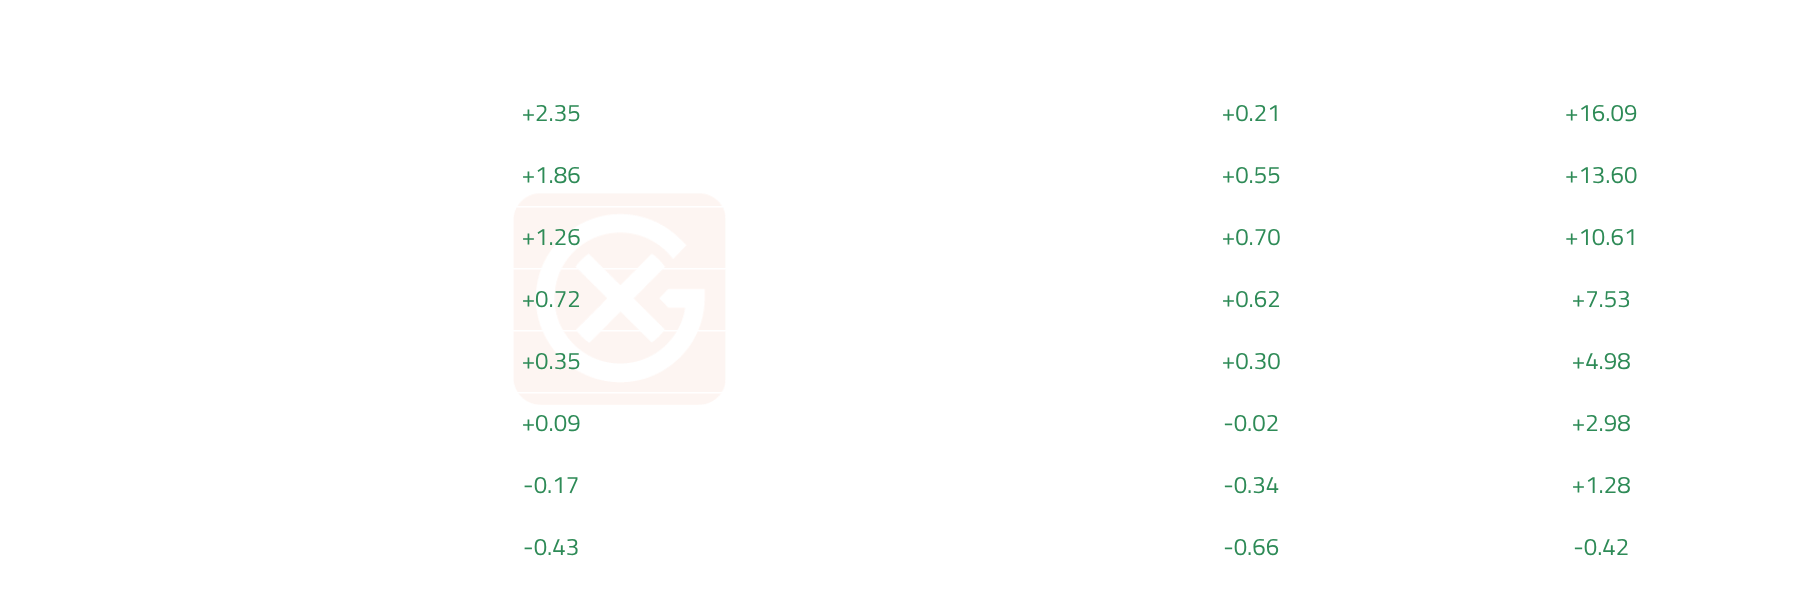
- CFD curve W1-W8 open vs close:
Physical cargo activity:
In the physical market, strong buying interest was seen across multiple grades, pushing up the assessed differential to the Dated Strip up to +$6.225/bl on 27-Mar vs -$0.825/bl on 27-Feb. Johan Sverdrup saw the biggest grade differential swing of the month, its average reversing from -$2.53/bl (February) to +$5.59/bl - a +$8.12/bl MoM shift. Physical cargo trades totalled 13 in March vs 15 in February.
Grade Differentials vs Strip - March 2026 averages vs February 2026:

- Physcial cargo trade activity - March vs February 2026:

- Offer count more than doubled in March (24 → 60), while bid count was flat (65 → 64) - a significant shift in balance.
- Traded volume fell 45% MoM despite the flat price rally.
Top 5 sell-side companies - physical cargoes:

- Gunvor was the dominant physical seller in February (5 trades) but did not appear in the March top 5.
- BP, Vitol, and Trafigura appeared in both months' top 5 sellers.
- Aramco Trading entered the sell-side top 5 in March; Mitsui dropped out.
Top 5 buy-side companies - physical cargoes:

- Glencore emerged as the dominant physical buyer in March with 6 trades, absent from February's top 5.
- Vitol and TOTSA were top buyers in February; both appeared in March but with reduced activity.
- Eni and ExxonMobil (EXTAP) entered the buy-side top 5 in March; Mercuria and Shell dropped out.
.png)

.webp)